The AKARI Far-Infrared All-Sky image data are completed and released to the researchers across the world. The new AKARI image maps have four to five times better resolution than that of conventional far-infrared all-sky images, as well as data at longer wavelengths. The AKARI image data are expected to contribute to a very wide variety of astronomical studies, for instance in areas of star and planet formation and galaxy evolution.
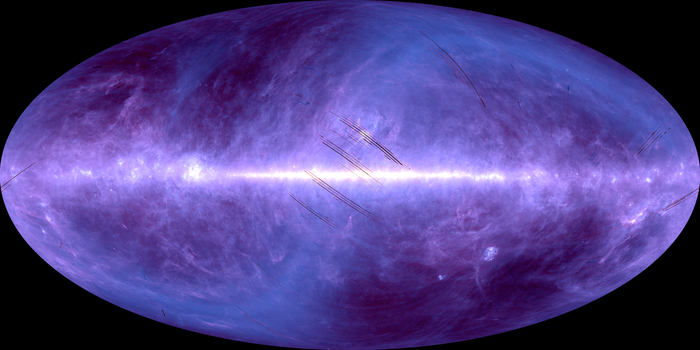
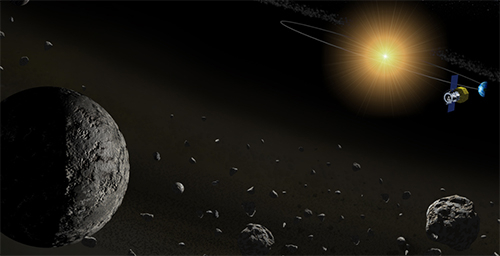
The far-infrared all-sky image maps are created by the research group of Yasuo Doi, Assistant Professor at the Graduate School of Arts and Sciences, the University of Tokyo, and collaborators, using data from the AKARI infrared astronomical satellite (Figures 1 and 2). The data has been released via the Internet from Institute of Space and Astronautical Science (ISAS)/ Japan Aerospace Exploration Agency (JAXA).
Dr. Yasuo Doi and collaborators completed creating the image data from FIR all-sky survey observation data provided by the infrared astronomical satellite AKARI. Raw data directly from the onboard instrument cannot be used for scientific research. As raw data contain artifacts from the instruments or space environment, they must be corrected and calibrated. Such data processing takes enormous time, skills, and knowledge about the instrument and is not reasonable to be carried out by each researcher. The image data provided by the research group are already calibrated, so researchers can immediately start their own scientific researches.
The infrared astronomical satellite AKARI was launched in 2006 through the cooperation of ISAS/JAXA, the University of Tokyo and other universities in Japan, as well as the European Space Agency (ESA) and others. One of the scientific goals of AKARI is to conduct infrared all-sky observation. AKARI observed more than 99% of the entire sky over a period of one year and four months. The All-Sky images are 1 to 1.5 arcminute resolution, in four wavelengths of 65, 90, 140 and 160 micrometers.
The far-infrared all-sky images widely used so far by astronomers has been those created from the observation data of IRAS (Infrared Astronomical Satellite, which was launched jointly by the United States, the United Kingdom and the Netherlands in 1983. Its final release of image data was in 1993.) The AKARI observation updates those of the IRAS after an interval of about 20 years, and are characterized by far greater image resolution and longer wavelengths.
AKARI's spatial resolution is four to five times better than that of the IRAS data. The AKARI images enable more detailed analysis of distribution of the interstellar medium and star formation activities within it. AKARI is also characterized by its broader wavelength coverage than IRAS. The longest wavelength in IRAS's observation data was 100 micrometers. In contrast, AKARI covers up to 160 micrometers.
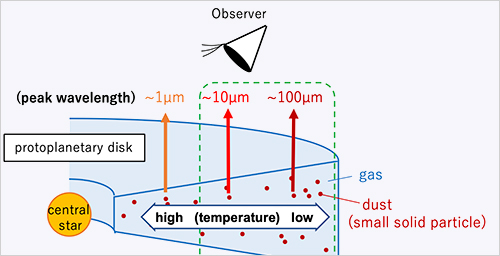
Far-infrared light is the key wavelength range for investigating the formation processes of stars and planetary systems. They are emitted mainly from the interstellar medium, especially of low-temperature dust. Far-infrared observations reveal the distribution of the interstellar medium, as well as processes of star formations within it. Also, observations of various galaxies in the far-infrared wavelengths allow us to explore history of star formation in the universe. Furthermore, closer examination of the interstellar medium distribution allows us to measure precisely cosmic background radiation, which is essential to investigate the origin of the universe.
When the interstellar medium gathers together due to the gravity, it forms into a "giant molecular cloud" that attains a size of hundreds of light-years. Then a dense part called a "molecular cloud core" with a diameter of less than a few tenths of a light-year emerges inside the cloud. The formation of stars and planets is considered to take place in the molecular cloud core. As it has been difficult to examine the large area of the sky with high spatial resolution by conventional observation, how a molecular cloud core emerges from a giant molecular cloud has remained unknown. The new AKARI images are the only data in the world that make it possible to closely examine the entire giant molecular cloud with a resolution of a molecular cloud core.
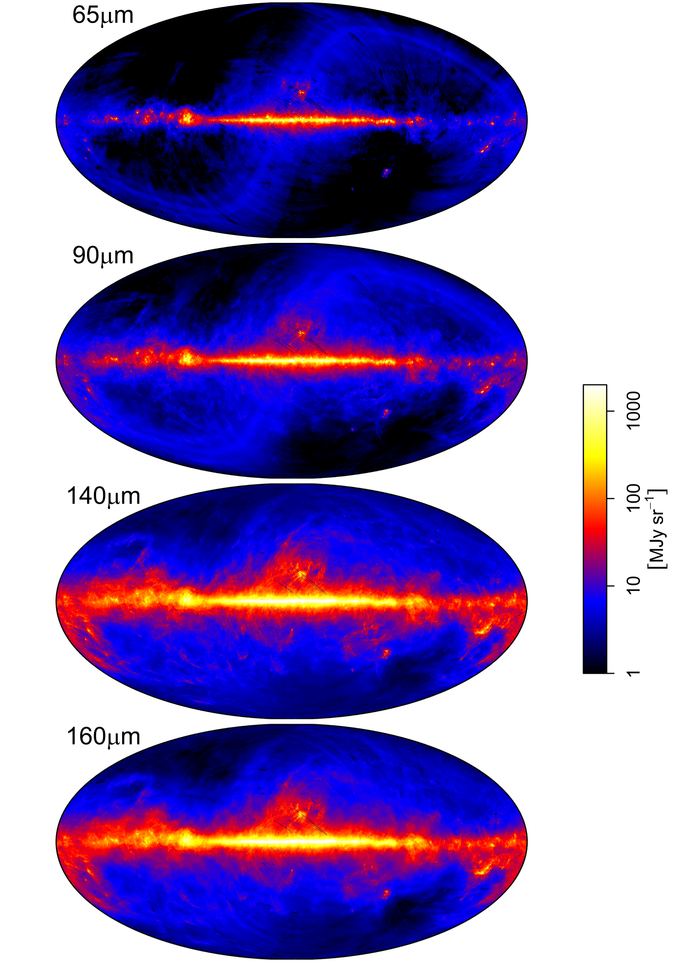
As seen in Figure 2, there is a clear difference in brightness distribution between 65,90 micrometers and 140,160 micrometers. This is because shorter wavelength infrared light indicates distribution of warmer interstellar medium, while that of longer wavelength shows distribution of warmer and cooler interstellar medium alike. With the additional observation at the longer wavelengths, is it possible for the first time to calculate accurately the temperature and amount of the whole interstellar medium. It becomes possible to know the total amount of interstellar medium necessary for star formation, and to predict the number and distribution of nascent starts through the distribution of interstellar medium warmed by a newborn star. All of this information would be very difficult to observe at other wavelengths.
This achievement is ascribed to the collaboration of researchers from the University of Tokyo, Institute of Space and Astronautical Science/JAXA, Tohoku University, and the University of Tsukuba, as well as Rutherford Appleton Laboratory and the Open University in the United Kingdom.
References:
Released data website (for scientists)
http://www.ir.isas.jaxa.jp/AKARI/Archive/Images/FIS_AllSkyMap/
Figure 1
Far-infrared all-sky image observed by AKARI. Represented as a two-color synthesis of blue: 90 micrometers and red: 140 micrometers. The Milky Way extends horizontally as the direction to the center of the Milky Way Galaxy is at the center of the image. The pale-colored, S-shaped part represents light from dust in the solar system. AKARI observed more than 99% of the entire sky to construct a detailed far-infrared all-sky map. The unobserved part of less than one percent is seen as black streaks on the image. Bluer areas indicate warmer interstellar medium, whereas redder areas are colder. It shows that more stars are being formed in the areas of warmer interstellar medium.
Figure 2
AKARI has generated far-infrared all-sky images in four wavelengths. The figure shows images of 65, 90, 140, and 160 micrometers respectively from the top. The Milky Way, which extends horizontally at the center, appears bright in each image. The images of longer wavelengths show the distribution of lower-temperature interstellar medium, which appears to spread toward upper and lower sides of the Milky Way. This difference is particularly conspicuous on the images of 90 and 140-micrometer wavelengths. The far-infrared images in wavelengths shorter than 100 micrometers have been observed by IRAS previously, whereas the images at two wavelengths longer than 100 micrometers are newly depicted by AKARI.
Figure 3
Figure 3, supplement
Figure 4
Figure 4, supplement
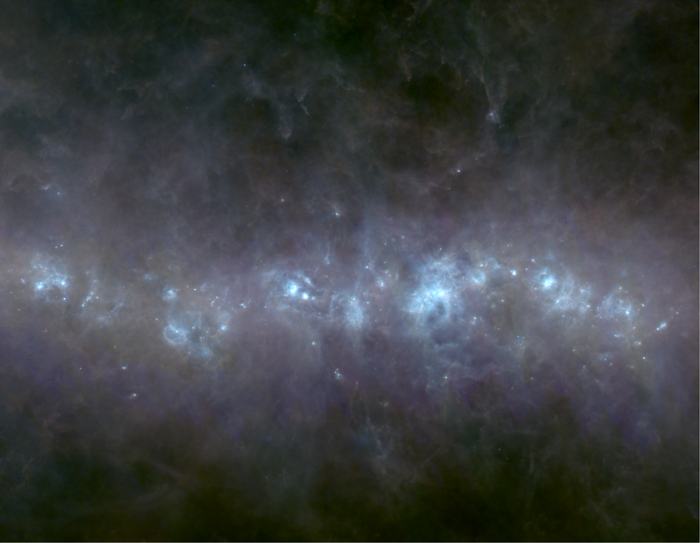
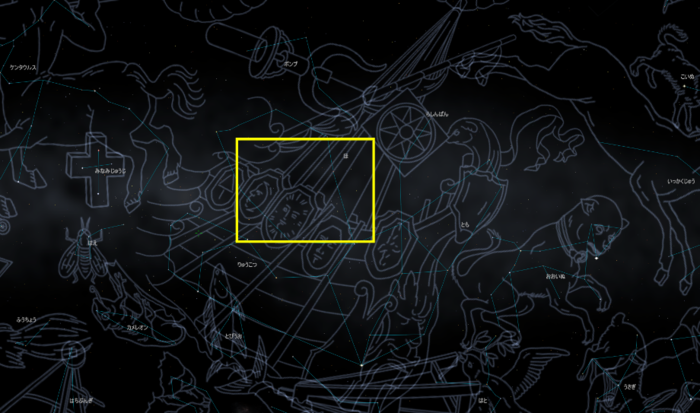
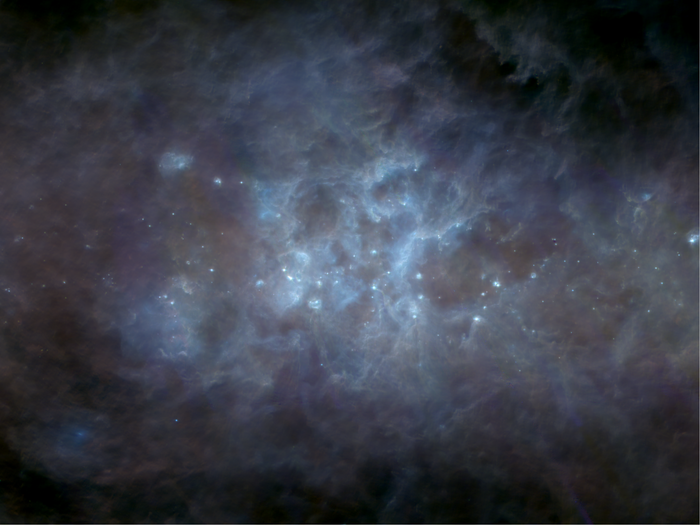
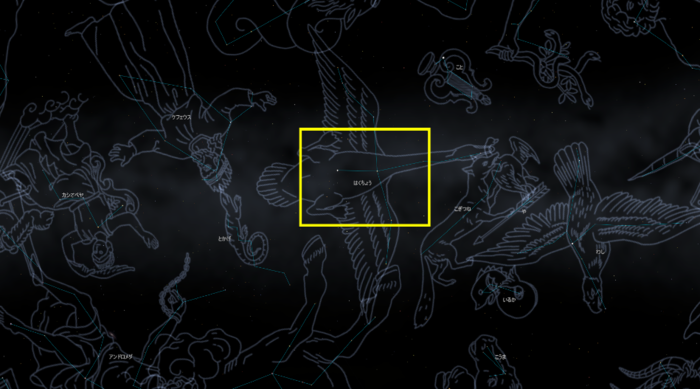
An enlarged view of the Milky Way observed by AKARI. Represented as a three-color synthesis of blue: 65 micrometers, green: 90 micrometers and red: 140 micrometers. Shown here are the Milky Way in the vicinity of Carina in the southern sky (Figure 3) and the central region of Cygnus (Figure 4). The supplements for the Figures 3 and 4 indicate the corresponding part of each image in the star chart (the star charts are taken from the trial version of StellaNavigator 10). Both images show 20° horizontal x 15° vertical. Like Figure 1, bluer areas show the existence of warmer interstellar medium, whereas redder show colder. The AKARI data reveal a detailed distribution of interstellar medium in the area where new bright stars are about to emerge in the Milky Way.

