
There are various kinds of "treasures" around the world, and the definition of treasures also varies. One of the treasures of the ISAS is long-amassed data on space science. Much of them are consolidated in the archive of the space science data, called DARTS, and open to the world. The basic policy is that anyone wishing is welcome to use the data. These space science data are well-known to researchers and being put to use by many people. In this column, I would like to talk about something interesting to the general public so that many can become more familiar with the space science data. There are still much data in DARTS that are unrecognized by the public, apart from the researchers of the field. In a season of the year, we explore such a hidden area to search for interesting treasures. It takes place around the time when the annual open-house event is held at JAXA Sagamihara Campus. During that time, project members of DARTS get together and discuss which space science data would be exhibited.
"Do not mix; Hazardous?"
During 2015 Special Openings, we exhibited the highlight scene of observed data from the Piggy Back Satellite "REIMEI" (INDEX). REIMEI is a scientific satellite that has been observing auroras for a long time, however, images contained in the topics on P.R. Website (such as "Small Scientific Satellite REIMEI and Auroral Observation") were limited. On the other hand, DARTS publishes all moving images of REIMEI. The total number is close to 7,000. Now, how can we unearth the highlight scene from among them? If you check all the moving images one by one, the sun will set. (And you will probably experience the sunset many more times!)
We therefore decided to mechanically search for attractive ones from published moving images that can become a part of highlight scene. First, we performed two-dimensional FFT (Fast Fourier Transform: a method to convert a signal in the time or space domain to a representation in the frequency domain) according to the frames of the amassed moving images, and calculated variance of low-frequency-component. Next, based on the calculated result, we picked up data which variance is large. Under the rule of thumb, images with larger variance looked impressive, but images other than auroras were also mingled among them. "After all, sorting needs man's hands", we thought with a feeling of resignation, and further gazed at them. Then we found that they included images of landscapes and luminescence phenomenon supposedly that of thunder. Putting the scientific significance aside, we reconsidered they were interesting in and of themselves, and decided to leave the scenes along with those of auroras as options for highlight.
As the next step, we needed to decide how to exhibit them. The original observation device (MAC; Multi-spectral Auroral Camera) observes wavelengths; 670, 557.7, and 427.8 nanometers, and each of them addresses luminescence of oxygen, nitrogen and so on. To scientists, the clear difference between these three unique wavelengths itself is significant, however, oddly enough these have wavelength near the three primary colors of light. Then we got curious. What happens if we mix them? This time, we combined three colors - R (red), G (green), and B (blue). (Figure 1) This very simple task brought us a shock such as that we experienced when black-and-white television was reborn as color television. (Oh, you say you don't understand what I'm saying, for color television was always there since you were born?)
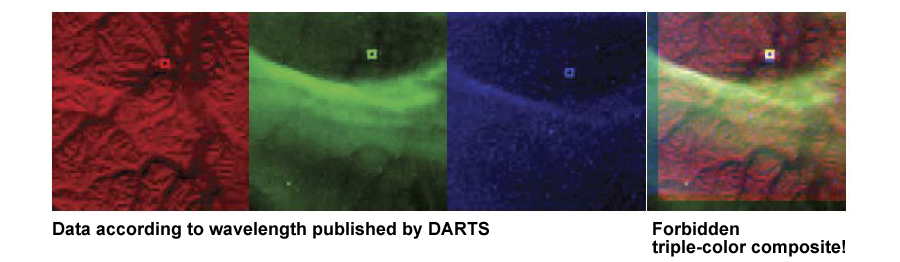
Figure 1.Observed data from the Piggy Back Satellite REIMEI
The contents exhibited during the open-house event are available to the public on a permanent basis at "Cosmic Calendar" on the Website "Space Science Showcase". (Figure 2) There you can see signature images of the Sun, and many other images taken by the asteroid explorer HAYABUSA and X-ray astronomical satellites, that are lined up in a calendar form. Try to find your special image of "that day" and of "that time".
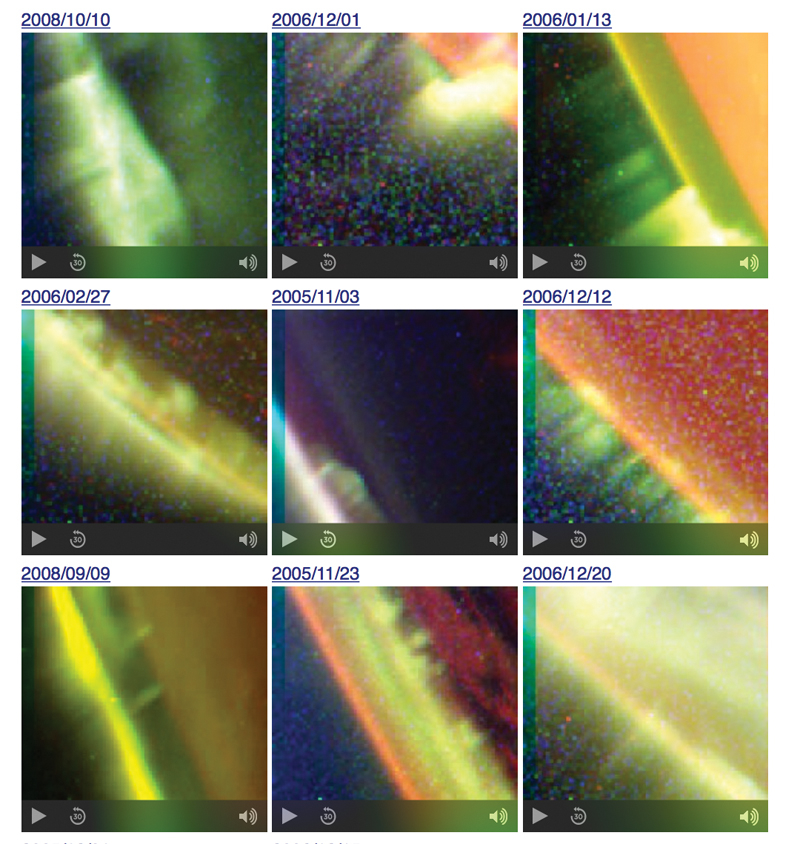
Figure 2. REIMEI highlight
"The color of the sky of that day..."
Next, I would like to talk about the observed data from infrared astronomical satellite"AKARI" (ASTRO-F) and X-ray astronomical satellite "ASCA" (ASTRO-D) and "SUZAKU" (ASTRO-EII).
The all-sky data from AKARI are open to the public in the format for researchers, called FITS. We have just set out an approach to make the data available as images easily enjoyed by the general public. Basically speaking, this task calls for faithfully creating all-sky images based on the original published data. Here we need to decide one important element. That is "color". In the case of AKARI, all-sky data of four wavelengths of far-infrared radiation are observed and made open to the public, but none of them are seeable light to our physical eyes. Since we do not know the real "color", we need to allocate the seeable colors.
In the field of astronomy, short wavelength colors (cold colors) are assigned to short wavelength (high-temperature side), and long wavelength colors (warm colors) are assigned to long wavelength (low-temperature side). (Figure 3, left) The sky of far-infrared radiation observed by AKARI depicted in red may bring a warm impression, but in reality, the observed data of long wavelength reflects extreme cold, so freezing that you can nail with a banana. The observed data of short wavelength that are often depicted in blue reflect far warmer environment. On the other hand, in the field of thermography, warm colors are assigned to high-temperature side, and cold colors to low-temperature side for visualization. (Figure 3, right) Each color combination has its reasons, and as a result, we see the opposite results. Which do you prefer?
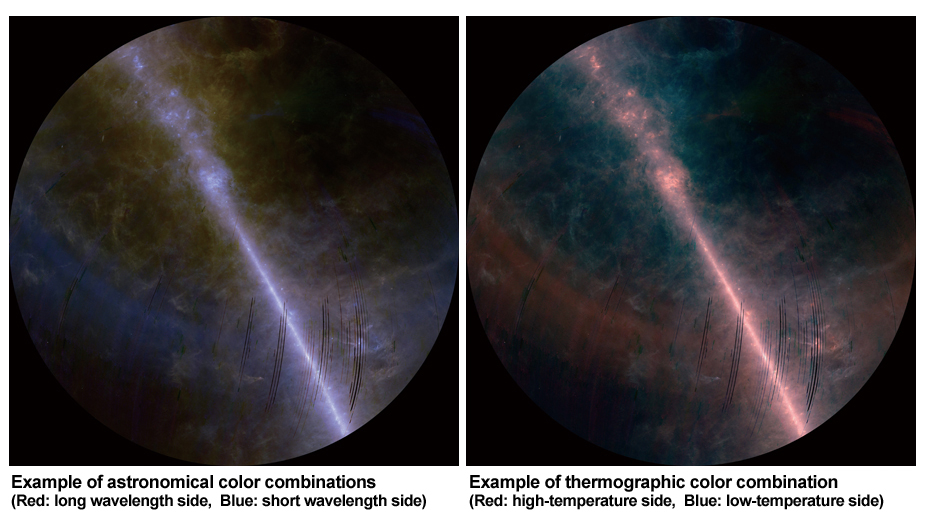
Figure 3. What color of the sky does AKARI see?
Another two wavelength mid-infrared rays (9, 8 micrometer) will soon be added to AKARI's published data. We will be able to see the universe in more various wavelengths. What colors do you think we need to assign them?
Next, I'd like to talk about invisible light with very short wavelength.
Unlike general astronomical photographs, energy ("colors" in the case of visible light) and observing time of each of the light corpuscle of the observed data from X-ray astronomical satellite such as ASCA and SUZAKU. In other words, they make up moving images of a special format. For instance, a neutron star, called Crab Pulsar, repeats blinking in the cycle of 30 times a second. Even if you can photograph the scene with a video camera, it is difficult to film such high-speed pulse. However, with observed data of ASCA, for example, such fast blinking can be drawn as moving images. Pulsar's rhythmical blinking can be replayed by superimposing a series of seemingly random events while moving the amount equivalent to the blinking cycle.
If you are interested in seeing the starry heavens looked up by ASCA, SUZAKU and AKARI, please enjoy the images made available at the official channel of International Festival of Science Visualization. Please note that this work was created for full-dome screen, therefore, the images may warp greatly when seen on regular computers.
"In search of lost trajectories"
The data in the SPICE format can compile the location and position of probe vehicles and the stars. With such information, when and where probe vehicles are flying can be pictured.
The recently published, impressive data in the SPICE format may be the estimated orbit of Venus climate orbiter "AKATSUKI" (PLANET-C) as it put into orbit around Venus. Additionally, the trajectories of "HAYABUSA" (MUSES-C) around Itokawa Asteroid are also made available to the public in the SPICE format. The shape and rotation data of Itokawa are also published, and by combining these, the computer graphics of the rendezvous of HAYABUSA and Itokawa can be created.
For the 10th anniversary of launching of HAYABUSA, the esteemed trajectories of HAYABUSA in the past were replicated by computer graphics by using data in the SPICE format. (Figure 4) At that time, we were unable to replicate the scene where HAYABUSA made a touchdown to Itokawa. Actually, we didn't have the position data near the touchdown location. We really wanted to replicate the scene by all means. So we searched through papers to find out overlooked data. Very fortunately, we found the data indicating the distance to Itokawa in 4 directions measured by HAYABUSA before and after the touchdown. They were as if four "legs" of HAYABUSA stretched toward Itokawa. Then we assumed the corresponding points of the "toes" seen from HAYABUSA and Itokawa's shape model when hypothetically speaking HAYABUSA were thrown toward near Itokawa. The hypothesis generated in this way was made into computer graphics of enlarged edition and published in "Space Science Showcase". If the Little Prince existed on this starlet, perhaps he might have seen the scenery like this.
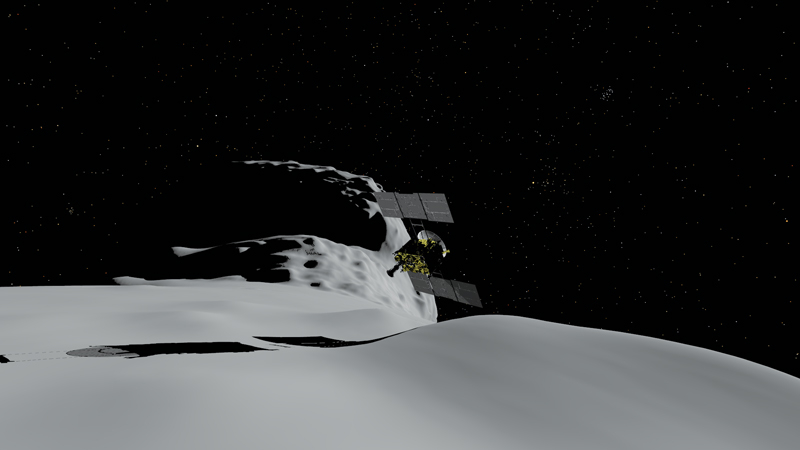
Figure 4. "Hello, the Little Prince!"
To what extent can we find out the unknown trajectories of HAYABUSA? It all depends on the efforts and willpower of the expedition team.
Though it may be at a snail's pace, we hope to proceed with the expedition and share with others the forefront information on space science. In the event we find an unexpected dungeon that stands in our way in the future, let me share with you the story somewhere, someday.
(Akira Miura)
ISAS News: March 2016 issue