
Why is the solar corona so hot? The question of why the solar corona is so hot has puzzled solar physicists for many years. In order to solve the mystery, a number of ground-based telescopes and satellites were developed around the world. Despite of such an effort, we have not found the answer to the question. The "coronal heating problem" has been one of the main focuses of missions currently being developed or discussed. This current situation may give you an impression that have not advanced at all in the study of coronal heating. This is not true. The understanding of the mechanism through satellite observations has greatly advanced, and the substantial research content has evolved dramatically. Specifically, observations though the Hinode satellite have found some magnetic waves that seem to be playing an important role in heating the corona. This discovery, together with the data collected by NASA's solar observation satellite IRIS (Interface Region Imaging Spectrograph), has finally led to the detection of magnetic wave dissipation.
In this article, I will talk about the approaches to the study of Coronal Heating using these solar observation satellites.
Chromospheric activity observed by Hinode
So, why am I talking about the chromosphere when our focus is on the corona? Because we cannot talk about the corona without understanding the chromosphere. The solar atmosphere consists of three layers: the photosphere (whose temperature is about 6,000 degrees), chromosphere (10,000 degrees), and corona (1 million degrees). The photosphere has a thickness of about 500km, while the chromosphere is about 2,000km thick. The corona is the layer above these two layers. Explanation of the solar atmosphere would have been much simpler if these three layers consisting it were parallel to each other. In reality, however, some part of the chromosphere is extending into the layer above it, or the corona, and part of it is even moving through the layer (see Figure 1). This inconsistency is due to the fact that the sun's atmosphere is divided into these layers based on the temperature. The gas with a temperature of around 10,000 degrees is called "chromosphere", regardless of how far it is from the Sun's surface. Likewise, the corona is the gas with a temperature of around 1 million degrees. Due to this, plasma with a temperature of around 10,000 degrees that exists within the corona, such as prominences and spicules, is also defined as chromosphere. I should note that these prominences and spicules which are categorized as chromosphere should not be treated in the same way as the regular, flat chromospheric layer.
When we look at the chromosphere observed through Hinode (Figure 1), we can see that it has a structure consisting of fine thread. A video which captured its motion shows that it keeps moving very actively. This is one of the "surprising" facts that Hinode has discovered, which reaffirmed how complex the study of coronal heating is. Until this discovery, it was believed by solar physicists that the chromosphere is just a layer which lies between the photosphere and the corona and is of no importance in exchange of energy between these layers. Now that we know the middle layer is this active, it is natural to think that understanding how the corona is heated requires the understanding the behavior of the chromosphere as well as the amount of energy accumulated within the layer.
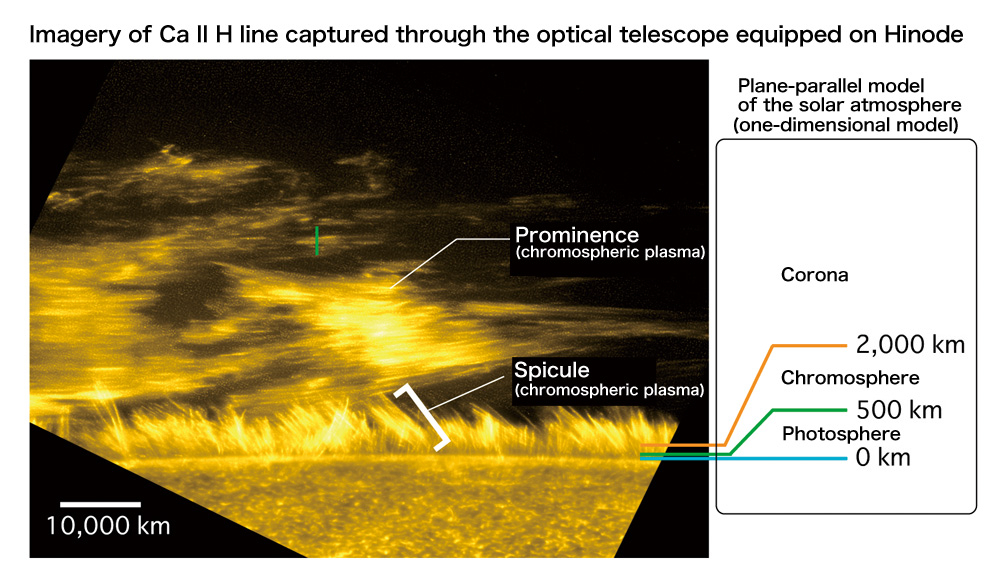
Figure 1. An image captured through Hinode and the parallel model for the sun's atmosphere
Left: Chromospheric structures on the solar limb captured through Hinode. What is shown on the bottom of the image is the surface of the Sun, while the thick layer shown on the upper half of the image is the corona. The trailing streaky flux is a prominence. This false-color image includes the light emanating from the plasma with a temperature of about 10,000 degrees.
Right: the conventional model for the solar atmosphere. In this model, the transition layer, which exists on the boundary between the chromosphere and corona, is omitted and shown as part of the chromosphere. The temperature of the chromosphere rises sharply at this transition layer.
Discovery of wave
You may think that the video captured by Hinode tells us everything about the dynamics of the chromospheric plasma. Unfortunately, just watching the video does not give us much information. We still have to devise a way to deal with time series data, or analyze the feature whose appearance is constantly changing in order to extract data relevant to and necessary for our study. This is more difficult than you might think.
As an example of such analysis, let's look at the motion of prominences. As noted above, a prominence is chromospheric plasma extending into the corona. In fact, this is a very interesting point. In order to understand the mechanism of coronal heating, it is natural to think we need to observe a high-temperature constituent with a temperature of 1 million K. Analyzing prominences whose temperature is much lower than that and about 10,000 degrees sounds somewhat ridiculous. However, as the fine structures captured through Hinode is considered to be visible magnetic field lines within the corona, analyzing such structure means examining the movement of the magnetic field within the corona. The highest spatial resolution available for observations of the corona is 1 arcsecond at best. We cannot directly resolve the fine structures with that spatial resolution. However, since prominences are part of the chromosphere which exists in the corona, they can be captured by Hinode's Solar Optical Telescope and observed at a high spatial resolution of 0.2 arcsecond. So, we analyzed the dynamics of prominences based on this point. What we found through the analysis was something unexpected. We discovered "waves". Hinode captured subtle tremors of the fine structures which consists of a prominence. These tremors are if fact the oscillation of magnetic field lines caused by the Alfven waves propagating through them. Hinode became the first to capture the waves propagating through the corona by spatial resolution.
This discovery by Hinode was followed by many other observations reporting the same phenomenon. It is now certain that the solar corona is permeated with such magnetic waves (Figure 2). The energy of these waves is much greater than that necessary to heat the quiet corona. Until the launch of Hinode, it had been widely thought that nanoflares are playing an important role in heating the corona from the observations of flares and microflares by the satellite Yohkoh. Interestingly enough, it was another Japanese solar observation satellite which reignited the wave heating theory, which had been subsided for the past two decades. We can say that the study of coronal heating is led by Japanese satellite missions.
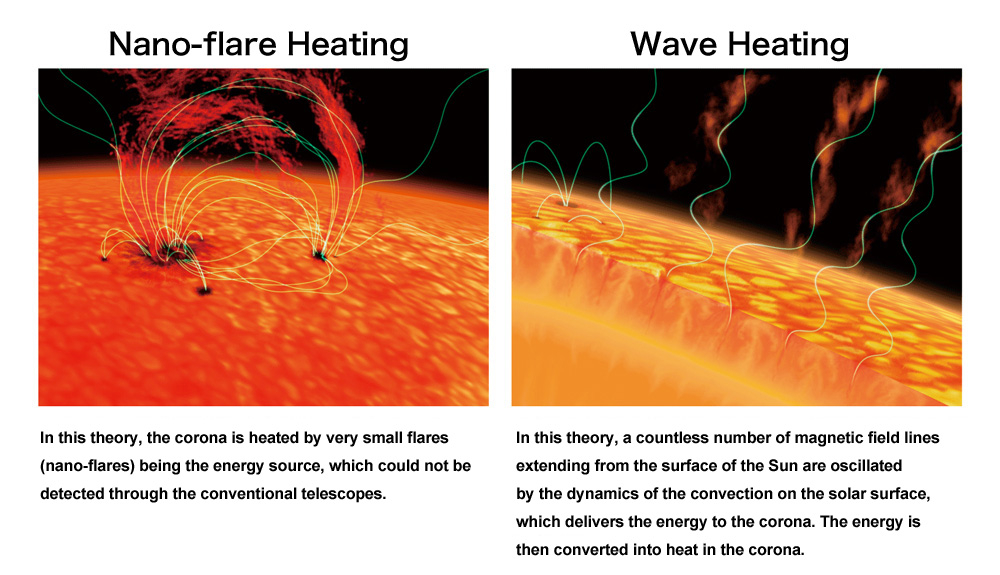
Figure 2. Nanoflare heating theory (left) and wave heating theory
The advent of IRIS
There is no doubt in the presence of waves in the corona. But now matter how much energy these waves have, they cannot heat the corona unless they are dissipated to contribute to the heating process. Until recently, there had been no report that shows heating by waves, and the mechanism of wave dissipation had remained a mystery. Although we had not known what we must observe to prove wave dissipation, we had known that we needed at least examine the physics of magnetic field line oscillation. This could not be done by Hinode, which, while it can capture two-dimensional dynamics, cannot observe the dynamics in the gaze direction. To supplement the abilities of Hinode and examine in more detail the active chromosphere observed through Hinode, the IRIS was launched by NASA in 2013. The IRIS is a solar observation satellite designed for spectroscopic observations (*) of ultraviolet. It has a very high spatial resolution comparable to that of Hinode and can capture phenomena being taken place and changing at high speed inside the chromosphere. Combined with Hinode, which provides two-dimensional images of the chromosphere through imaging observations, the IRIS enables us to observe the three-dimensional dynamics of the chromosphere by measuring the Doppler speed through spectroscopic observations. A joint observation by the two satellites was conducted.
* Spectroscopic observations: to decompose light into its spectral components based on the color (wavelength) like a prism. The IRIS enables scientists to examine the physical properties (such as velocity structure) of a plasma at a certain temperature, by diffracting magnesium absorption lines and silicon emission lines within the ultraviolet range.
Dissipation of waves
First, we analyzed how the temperature of an oscillating prominence rose from the two sets of observation data provided by the satellites. Then, we examined the oscillation pattern of the prominence. All we had expected was that the three-dimensional observation (which was impossible with Hinode, which provides only two-dimensional images of the dynamics) would enable us to estimate the wave energy more accurately. But what we found was beyond our expectations: we found strange oscillations in the data. The oscillations are shown on the top left of Figure 3. This shows the temporal changes in the structure crossing the green slit in Figure 1. The vertical axis indicates the direction of the slit (which runs vertically), while the horizontal axis shows time. The green dot is the center of the fine structure. This figure shows that fine structures oscillate vertically over time. The overlapped pink dots are the Doppler velocity of the fine structure calculated based on the observation through the IRIS. These oscillations are "unusual" because the correlation between these vertical oscillations and radial velocity is different from that of regular Alfven waves. (**) Focusing on this oscillation pattern, we interpreted the phenomenon through the radiative transfer calculation and the computational simulation by our co-researcher Patrick Antolin from NAOJ. As a result, we found that the oscillation pattern observed can be reproduced under the circumstance where a distinctive flux is created on the surface of the fine structures during the physical process called "resonant absorption"(***) along with the oscillation of a prominence. This simulation has also shown that this process causes the wave energy to dissipate, which contributes to heating the corona. This is the first case where the mechanism of coronal heating due to magnetic wave dissipation was revealed through observations by satellites.
** Oscillation of a normal Alfven wave: think about a thread that vertically oscillates. The velocity of the thread (magnetic field line) is 0 when the thread is at the extreme position, while the thread obtains the maximum velocity when it passes the center position. To illustrate this in the same way as the top left graph in Figure 3, the radial velocity (pink dots) is 0 when the vertical oscillation of the background yellow is at the extreme position, while it is at the maximum speed when it at the center position of the oscillation. The waves detected through the observation do not follow this pattern, which means they cannot be explained by the behavior of simple Alfven waves.
*** resonant absorption: a phenomenon in which a global oscillation energy is converted into a torsional Alfven wave when the velocity of the Alfven wave in the magnetic flux tube vibration matches that of the Alfven wave in a layer of a density-stratified flux tube. This excites the Kelvin-Helmholtz instability, which then generates a countless number of turbulences on the surface of the flux tube to cause heating. See the bottom of Figure 3 for the complete process.
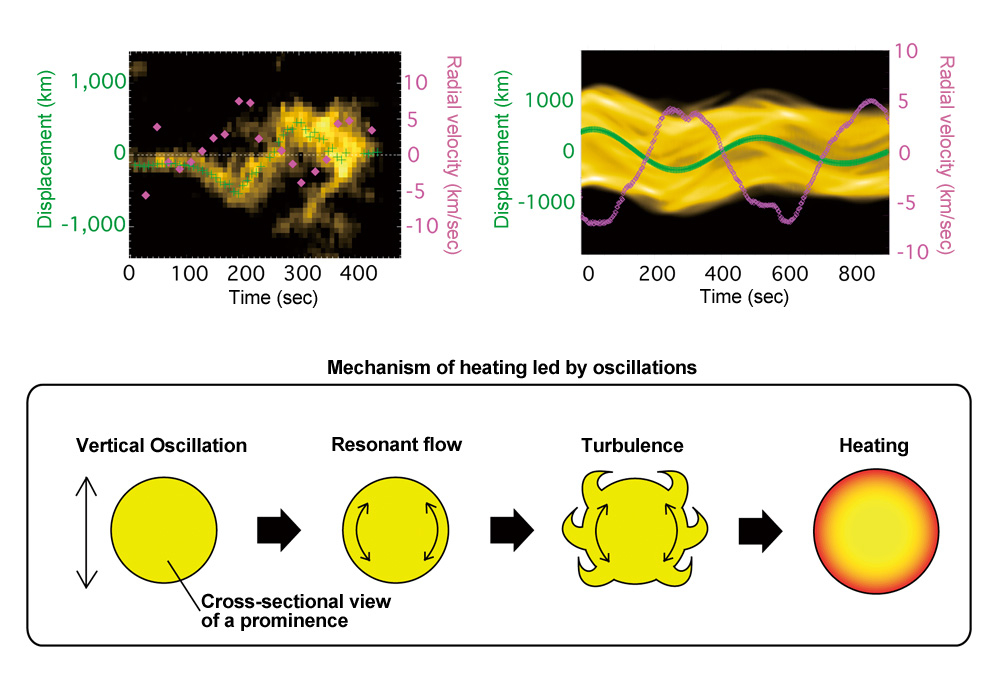
Figure 3. Observational evidence of magnetic wave dissipation and its interpretation
Top: comparison of the prominence oscillations observed by Hinode and IRIS and the numerical simulation. The left figure shows both vertical motion of fine structures captured through Hinode (shown in green and yellow) and radial velocity of such structures captured through the IRIS (shown in pink). The radial velocity is positive if a fine structure is moving away from the observer. It is negative if a fine structure is approaching the observer. The right graph shows the oscillation patterns obtained through a computational simulation under the same conditions as satellite observation.
Bottom: schematic diagram of the wave heating mechanism led by resonant absorption.
Future developments of the study of coronal heating
The presence of magnetic waves as well as dissipation of such waves were discovered by Hinode and IRIS. However, such dissipation was observed only in the particular prominence observed for this study, and we need further study on how frequently it happens as well as where it is likely to happen. Magnetic wave dissipation is sort of a complicated process which leads to the generation of micro-scale turbulence, but we need to find out how the wave energy and its dissipation are related to heating the corona to 1 million degrees. A key observation element here is the direct observation of the magnetic field in the chromosphere. Knowing the strength of the magnetic field is essential to accurately estimate the wave energy. The coronal heating problem will never be solved without this.
And it is also important to try to explain how the corona is heated considering the two proposed theories for coronal heating which are still discussed today, or the wave heating theory and nano-flare heating theory. Based on the non-uniformity of the corona observed through X-ray imagery, the universality of the convection of the surface of the Sun, the wave energy that has been estimated so far, as well as the time scale of the phenomenon, it is likely that the heating of the quiet area is led only by magnetic waves, while the active area is heated mainly by nano-flares where magnetic waves have a little contribution to it.
My opinions
Throughout my article, I have talked about coronal heating as if it was the ultimate problem to be solved in the study of the Sun. Revealing the mechanism of how the corona is heated will bring us to the next question: how solar prominences are formed. Low temperature prominences are thought to be formed as a result of the cooling and condensation of the high temperature corona. In this theory, prominences will not be formed unless heating takes place and the corona is generated. Moreover, as explained in this article, re-heating has been observed within the prominence that was cooled down. The energy balance between the corona and prominences is quite difficult to understand. Also, prominences are formed on certain areas, repeatedly. While it is thought that where they are formed is dependent on the energy balance and the shape of the magnetic field of the corona, the conditions under which a prominence happens have still remained a mystery. This is my ultimate goal in research. To me, studying the mechanism of coronal heating is just a one of the steps to reach the goal.
(Joten Okamoto, translated by PRAGE.Inc)
ISAS News: February 2016 issue