
SMILES Full of "First Times"
Are you aware of the SMILES (Superconducting Submillimeter-Wave Limb Emission Sounder)? Above the troposphere (0~15km) where there will be weather phenomena such as typhoon and thunder, there covers the stratosphere (15~50km) with the ozone layer. The ozone layer is playing an important role in absorbing ultraviolet which is harmful for creatures on the ground. However, it was severely depleted by anthropogenic substances (generally chlorofluorocarbons called Freon). Afterwards, an international treaty (the Montreal Protocol in 1987 and its amendments) was adopted to regulate the emission of ozone depleting substances and it is gradually taking effects. However, predictions on the recovery of the ozone layer by various research institutes differ greatly with each other, and there are concerns on the effects of global warming on the concentration of ozone. To know the situations correctly and to evaluate the future, it is required to perform the high-sensitivity global observations of the stratospheric ozone along with the trace gases (the other molecules except dinitrogen and hydrogen), and the SMILES was responsible for that (Figure 1).
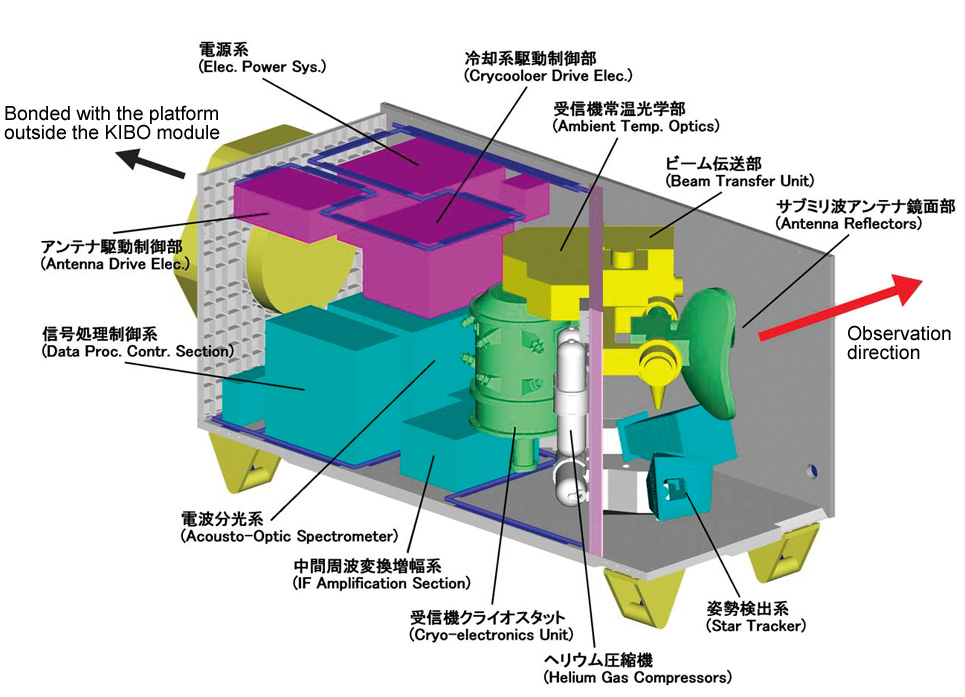
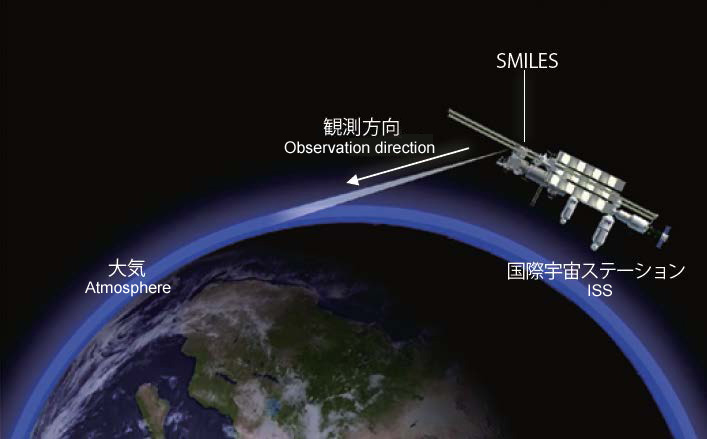
Figure 1. Structure of SMILES and observation schematic
The SMILES, heading its antennas towards the Earth's atmospheric limb, observed emission from the stratospheric trace gasses within the submillimeter-wave region with a high-sensitivity.
SMILES was launched on 11th September 2009 by the H-IIB testing rocket, carried to the International Space Station (ISS) on the 25th by the HTV "Kounotori" testing vehicle and was attached to the outside platform of the Japanese Experiment Module "Kibo". It was as well supposed to conduct the first space technology demonstration of the 4K mechanical cooler (absolute temperature 4K= -269°C) and the superconducting mixers for detecting the weak submillimeter waves from the trace gasses . I felt concerned whether it was able to conduct the observation with so many "first times", but during a half year since the October of 2009, it has conducted the atmospheric observation with the highest-sensitivity among the observations so far and has brought us a lot of new knowledge in the atmospheric science field. In this article, I'm going to introduce two researches on the achievements of SMILES and give an overview on the next observation plan.
Diurnal Variation of the Stratosphere Ozone Revealed
As mentioned above, the stratospheric ozone is preventing creatures on the ground from the harmful ultraviolet and is additionally taking effects on the heat balance of the earth, playing a very important role in the formation of the climate. Therefore, we have been monitoring the ozone through many methods so far.
On the other hand, Takatoshi Sakazaki, the Japan Society for the Promotion of Science Research Fellow (PD) of Research Institute for Sustainable Humanosphere, found that there is a diurnal variation in the ozone in the stratosphere (Figure 2) with the high-sensitive and non-sun-synchronous observation data (*1), which is the features of SMILES. Additionally, according to the analysis of chemical transport model (one of the numerical models for calculating the distribution and variation of the chemical substances in the atmosphere), they found that for the diurnal variation of the stratospheric ozone is not only the photochemical change (influences from the diurnal variation of sunlight) but is also influenced by the dynamics effects (vertical transport effects from the updrafts and downdrafts following the atmospheric tide).
(*1) Non-sun-synchronous observation data: while the satellite is on a non-sun-synchronous orbit, it is able to conduct observations at different local time, so as to be able to investigate the diurnal variation phenomenon.
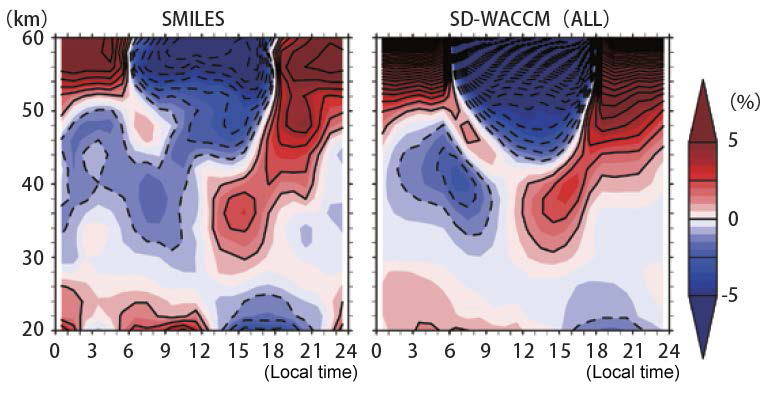
Figure 2. Time-hight sectional view of the diurnal variation of the tropical ozone concentrations (10°S~10°N).
The left is the observation result of SMILES while the right is the simulation result of the chemical transport model (SD-WACCM). The unit is the ratio to the daily average. (Sakazaki et al., 2013)
The result is important because the mean deviation of the diurnal variation reaches 8% at most and we cannot ignore this amount for evaluating the trend analysis of ozone concentration. Since the observation data from almost all the satellites on the sun- synchronous orbits or the scheduled balloon and ground-based observations used for trend analysis has a deviation in observation time, there is a need to make corrections in regard of the diurnal variation. This result has been published on the journal of geophysics, "Journal of Geophysical Research (JGR)". Additionally, the new knowledge about the variation in ozone concentration has been included in the "Scientific Assessments of Ozone Depletion: 2014" published by United Nations Environment Programme (UNEP) and World Meteorological Organization every 3 or 4 years which describes the current situation and forecast of ozone depletion.
Demonstration of Ozone Photochemistry with Eclipse
To increase the precision of the chemical transport model used for predicting the recovery of the stratospheric ozone, generally we will furthermore deal with the upper layer mesosphere (50~80km). Although ozone concentration in mesosphere is considered to stay certain since the mechanism is more simple than the layers below, it has been pointed out that the observation for years is inconsistent (*2) with the chemical transport model. It is of course because the model is incomplete, but we still do not understand whether it is caused by chemical reactions or phenomena we do not know or the ground experiment results such as the chemical reaction coefficient are not taken by the model correctly. Therefore, there has been more and more necessity to confirm the factors determining ozone concentration.
(*2) The inconsistence of observation with the chemical transport model: The chain reactions with HOX (general name of H, OH and HO2) are believed to be a dominant driver of ozone loss and it has been pointed out the discrepancies between observed and modeled HOX concentrations (HOX dilemma). Therefore, the inconsistence between observed and modeled ozone is considered to be because of the chemical reaction process with HOX but it remains unsolved.
On the 15th January 2010, during the observation of SMILES, there occurred the longest annular solar eclipse of this millennium. During the eclipse, SMILES happened to observe the shadow field of the moon (Figure 3). As you know the eclipse is a natural phenomenon that the solar irradiance temporally changes, but the research team and I considered it to be a perturbative experiment on the whole earth and started to analyze the observation data of SMILES so as to inspect the existing theories on the ozone photochemistry.
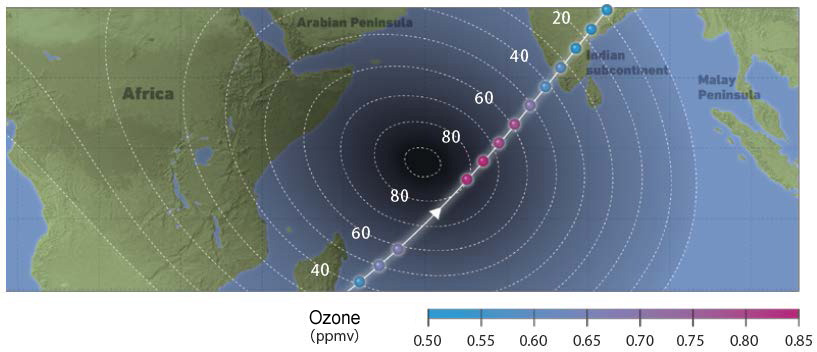
Figure 3. The mesospheric ozone concentrations observed by SMILES during the eclipse.
The white dotted contour lines are showing the magnitude of eclipse (ratio of the apparent size of the Moon to the apparent size of the Sun during an eclipse) by every 10% and the circles on the white line are the observation points of SMLIES. Additionally, the colors of these points indicates the mixing ratio (the number of moles of gas X included in 1 mole of air, or the volume of gas X in per unit volume of ideal gas) of ozone at 64km (mesosphere).
Figure 4 is the result from the comparison between the theoretical formula and the observation of SMILES. Generally, it shows the increase of ozone (y-axis direction) with the dimming (x-axis direction) during eclipse. The relational expression derived from the theory of the top and bottom of the mesosphere will differ depending on the difference of the main chemical reaction, but it consistent with the SMILES observations. This means that our consideration on ozone photochemistry is reasonable.
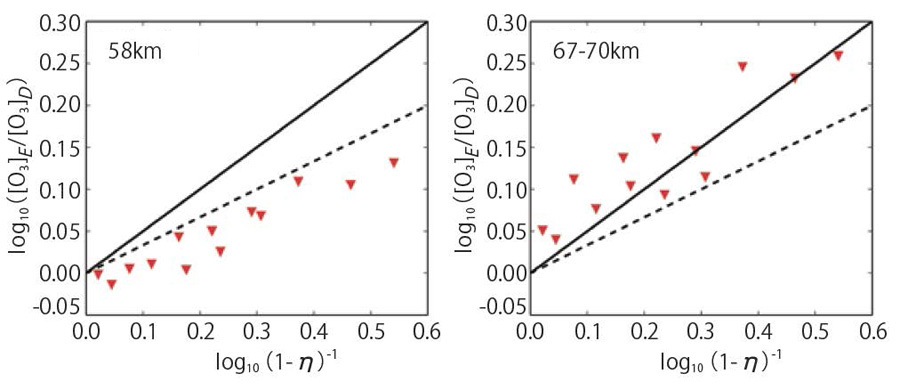
Figure 4. Changes of ozone with dimming during eclipse.
The left is the result of 58km (bottom of mesosphere) while the right is that of 67~70km (top of mesosphere). The vertical axis is the ratio of ozone concentration during eclipse to daytime (that is the change of ozone concentration) and the horizontal axis is the dimming rate, and both are given with logarithms. The dotted and solid lines are the relationships from the theories of top and bottom mesosphere. (Imai et al., 2015)
This research is a demonstration of ozone photochemistry with the rare phenomenon eclipse, as well as a cross-field combined study of astronomy and atmospheric science. The results have been published on the geophysical journal "Geophysical Research Letters" (GRL) and the three institutes (JAXA, NIES and RISH of Kyoto University) made a press release (*3) in June 2015.
Our team has succeeded to detect the changes of the trace gasses besides ozone during the eclipse and is analyzing the data.
(*3) Press release: Study on the impact of sunlight on ozone in the atmosphere using solar eclipses. (JAXA Press Release Jun. 12, 2015)
Towards the Next Observation Plan
With the high-sensitibe observation beyond the common sense of the atmospheric observation satellites, the SMILES has brought us with a lot of new knowledge. However, on 21th April 2010, unfortunately the observation had to be stopped atmospheric observation due to instrumental failures. We are now making the next plan to continue the high-precision observation.
The measuring instrument is designed to take the high-precision measuring of temperature as a priority along with the trace gasses. This is because it is necessary to know the thermal structure for understanding the earth's atmosphere, and to retrieve the altitude distribution of the trace gasses from the measured brightness temperature, we need the temperature information. (*4) At first, the SMILES aimed at deriving the altitude distribution of ozone from the bottom of stratosphere (15km) to the top of mesosphere (80km), but it became possible to derive that of higher altitude (100km at ver3.0 of SMILES level 2 (*4)) with the high-sensitivity observation of SMILES, which was beyond our imagination. However, there is no information of the temperature of that height, so we put a lot of efforts in processing the data. Measuring the trace gasses and the temperature at the same time has become a necessity to make full use of the high-precision data.
(*4) Deriving the altitude distribution from the radiation intensity: The radiation intensity observed by SMILES would be calibrated by the data processing system on the ground and the altitude distribution of trace gasses (Level 2 data) would be derived by the higher level system.
It is expected that the data of higher precision based on the demonstrated technologies of SMILES is not only used to watch over out atmosphere from the space, but also used for the scientific researches such as the inflow process of the substances from troposphere to stratosphere, the effects of the processes of middle atmosphere on climate change and the interactions between solar activity and upper atmosphere, as well as used as the basic data taken by the chemical transport model for predicting the future ozone layer.
(Koji Imai)
ISAS News: November 2015 issue