


TOP > Topics > 2007 > Observational results from the infrared astronomical satellite AKARI. AKARI observes star-forming regions in near-by galaxies and the distant Universe
![]()
Observational results from the infrared astronomical satellite AKARI. AKARI observes star-forming regions in near-by galaxies and the distant Universe
The initial results from the data taken by the Far-Infrared Surveyor (FIS) onboard the infrared astronomical satellite AKARI are reported from Nagoya University.
- The observation of the nearby galaxy M101.
- The deep far-infrared sky-survey programme.
These results will be presented in the Annual Meeting of the Astronomical Society of Japan in September 26th--28th, and also reported in the Publications of Astronomical Society of Japan (AKARI first results special issue).
1. Active star formation viewed from the outside: The peculiar spiral galaxy M101
by Toyoaki Suzuki (University of Tokyo)
Suzuki et al., 2007, PASJ special issue, in press
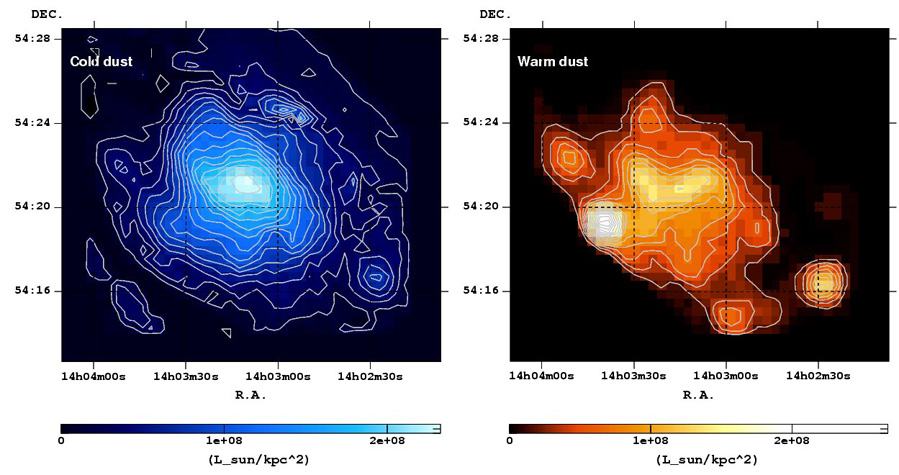
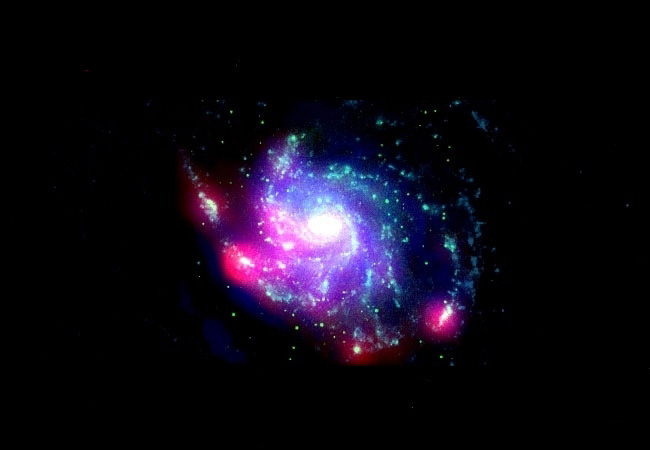
M101 is a spiral galaxy in the constellation Ursa Major lying about 24 million light years from the Earth. Its diameter is about 170 thousands light years, making M101 twice the size of our own Galaxy. Many young high-temperature stars populate the spiral arms with a remarkably giant star forming region present in the outermost arm in the galaxy. In order to investigate the star-formation activity in the galaxy we have carried out high-spatial resolution observations in all four wavelength bands of the FIS (65, 90, 140, and 160 micrometres). With these data we have been able to reveal the distribution of the the 'warm' dust heated by the young high-temperature stars in the star-forming regions, and the 'cold' dust warmed by the normal stars typical of our own Sun (Figure 1a). Figure 1b is a false colour image of the AKARI/FIS data shown together with the image of the same galaxy in visible and far-ultraviolet light to contrast the different distributions of the two dust components in the galaxy. It is seen that the warm dust is distributed along the spiral arms with many hot spots along the outer edge in the galaxy. These spots correspond to giant star-forming regions. On the other hand the cold dust clumps itself nearer the centre of the galaxy and in general is more evenly distributed over the entire galaxy.
The amount of warm dust should correspond to the formation rate of young, high-temperature stars while the amount of cold dust is indicative of the amount of gas required for the star formation. This means that active star formation is taking place where more warm dust than the cold dust is present. The AKARI/FIS data indicates that more active star formation is taking place in the giant star-formation regions situated in the outer regions of the galaxy than in the central region. In contrast, it is generally believed that star formation is more active in the central part of spiral galaxies like our own Milky Way. AKARI has revealed that M101 is a rather peculiar case have active star formation regions in the outermost extents of the galaxy.
M101 is known to have experienced a 'tidal interaction' with a companion galaxy in the past. It is suspected that the gas dragged out from the hapless companion is now falling onto the outer edge of M101 at relatively high speeds (approximately 150 km/s) triggering the active star formation. In fact observations show that the gas is indeed falling onto the outer part of the galaxy, although it is not fully understand why this is the case. Several more nearby galaxies have been observed by AKARI and these observations will throw further light on the physical mechanisms responsble for the active star formation in galaxies.
[Click image for enlargement] |
[Click image for enlargement] |
2. AKARI observes the distant Universe
by Shuji Matsuura and Mai Shirahata (ISAS/JAXA)
One of the most important unanswered questions in modern astronomy is how the galaxies evolved to their current form. To approach this problem it is vital to observe galaxies in the ancient era of our Universe, i.e., to observe galaxies that are very very far away. AKARI have carried out one of the most extensive observations ever made in the far-infrared wavelength range testing the ultimate performance of the FIS, and detecting many faint galaxies in the distant Universe. In order to ensure the best possible results, the target sky area had to be carefully chosen to minimize the contamination from the material inside our own Galaxy that would hinder the sensitivity of the observations. In other words, we looked out through a transparent window of our Galaxy to observe the distant Universe . The other unique point of these observations is the simultaneous observations in four wavelength bands (65, 90, 140 and 160 micrometres). This wavelength information is essential to investigate the radiation mechanisms responsible for the emission of the infrared light from the galaxies and to estimate the distance to the galaxies from the relative brightness of the different wavelengths.
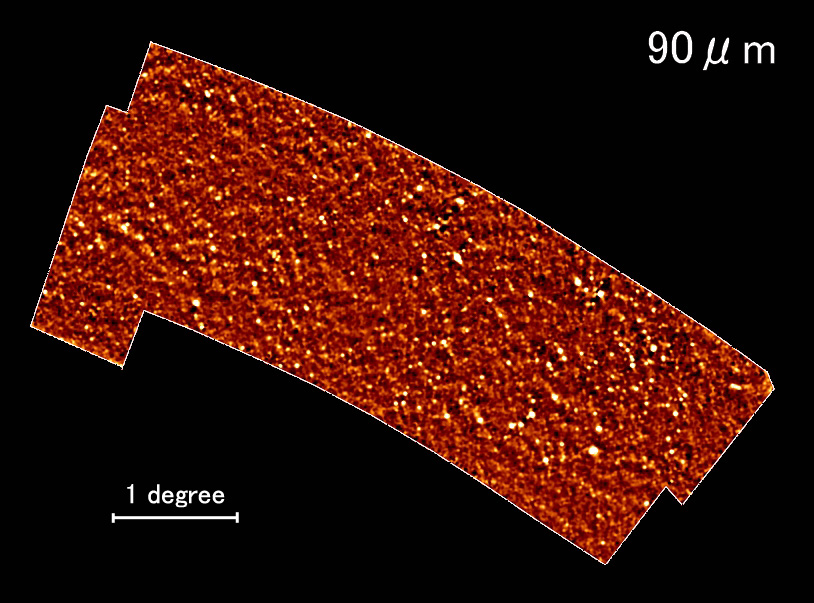
Figure 2a shows the far-infrared Universe through this 'Galactic window'. It is possibly the finest image of the Universe over a huge area of 10 square degrees and is the culmination of around 200 pointed observations with AKARI repeated over 16 months. It looks like sand on a beach but there are large numbers of beautiful shells visible! This particular image is at the wavelength of 90 micrometres. Enlargements of the images obtained in all four wavelength bands are shown in Figure 2b.
The white spots seen in the images are all faint galaxies of different brightness. The faintest spots may be galaxies in the farthest reaches of the Universe. This is the deepest image ever obtained at this wavelength. The results imply that the 'ordinary' galaxies we see at the present time shone very much more brightly in the infrared when they were younger. In many cases this is due to explosive episodes of star birth in their younger years. Examining the images carefully it is evident that some galaxies appear to have a different brightness at different wavelengths than the others. It is suspected that some of these galaxies may be brightened by the energy from a black hole at their cores.
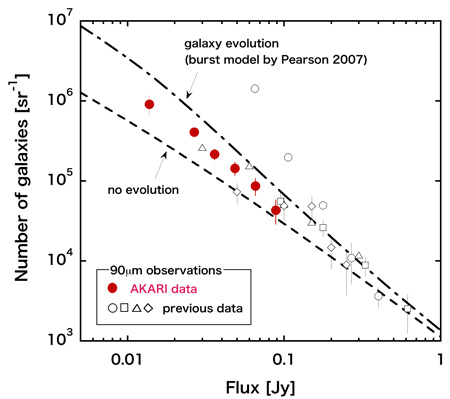
Figure 2c shows a count of the numbers of these galaxies at different brightness in a particularly transparent window through our Milky Way, in another region of the Galaxy, known as the "Lockman Hole". In general, galaxies close to the Earth are bright and are located to the right hand side of the plots where as distant galaxies appear fainter and sit towards the left. If galaxies did not evolve with time, and the intrinsic luminosity and number density of the galaxies was unchanging from the past to the present, the number counts should follow the model line indicated as 'no evolution'. However, AKARI data show that the number of galaxies increases rapidly as they appear fainter. For reference we also plot the results from the ESA's Infrared Space Observatory (ISO) satellite from observations made in the last decade. While the ISO observations show a large scatter in the data points, AKARI, thanks to the progress in observation instruments in the last 10 years, could detected fainter galaxies with observations in different areas of the sky being consistent each other. The line in the plot denoted as 'galaxy evolution model' is the expected number count assuming that there was significant star formation in the past. This model fits the data obtained by the Spitzer Space Telescope. Our data clearly indicates similar evidence of galaxy evolution but also shows a slightly lower number of galaxies than the model predictions. The Spitzer observations were made at different wavelengths (60 and 160 micrometres) to AKARI and the line in the figure is based on the presently assumed galaxy evolution model. Hence, our new results by AKARI hints at the necessity of a new galaxy evolution model.
The questions of whether such active star formation in the past took place all over the Universe, and how such galaxies look like now, are very important for studies into the evolution and structure of the Universe. The present data being the highest sensitivity with broadest sky coverage ever made, coupled with the large variety in wavelength range will aspire to answer these questions. In addition, note that in Figure 2b the infrared radiation from the regions between the galaxies was also observed. This background structure is due to the sum of the light from extremely faint galaxies not identified with individual objects. Such light is called infrared background radiation and may include radiation emitted from the very beginning of star formation in the Universe. Detailed investigation of these spatial fluctuations in the background and intensity at different wavelengths will reveal the origin of galaxy and structure of the Universe.
[Click image for enlargement] |
[Click image for enlargement] |
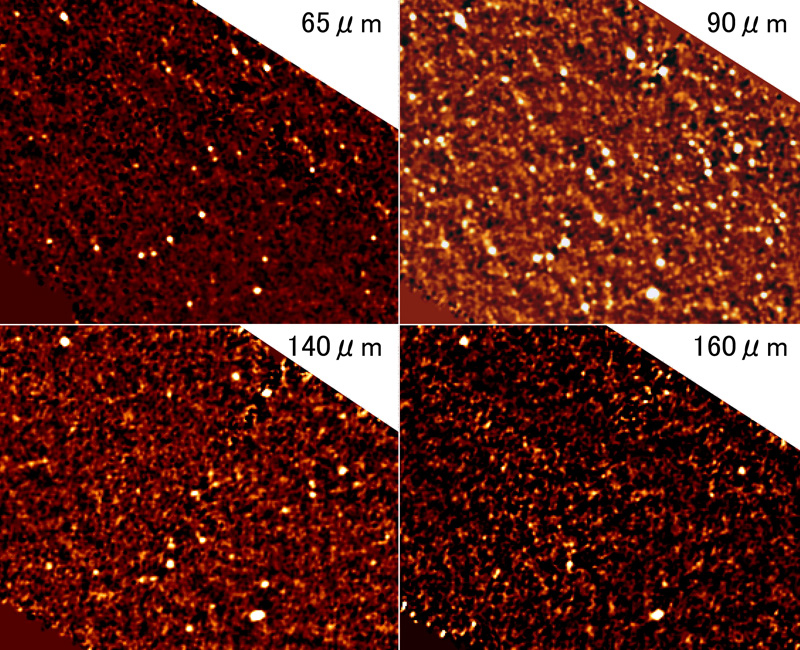
Figure 2c: |
September 5, 2007