TOP > Report & Column > The Forefront of Space Science > 2006 > Current Status and Future Prospects of Space-Environment Utilization in the Fundamental Science Field

 |

|
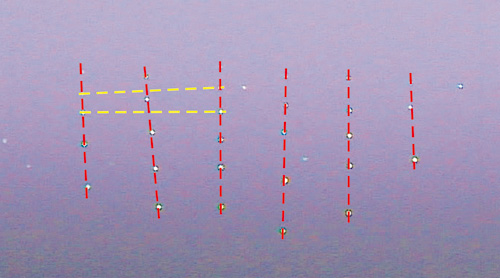
| Figure 1. Typical experimental result of Coulomb crystal formation |
Next, we designed and fabricated an experimental apparatus
to investigate whether or not self-organization of the structure is possible.
By using the apparatus we produced plasma and, then, put 1µm-diameter monodispersed
fine particles in it. As a result, we successfully formed Coulomb crystals as
shown in Fig. 1. The light source was green laser sheet light with a thickness
of 1 to 2mm. Even with sheet light as thin as that, it is possible to confirm
whether there are particles in the sheet light. This is because the depth of
field of an observation instrument is shallow and the brightness of particles
closing to the edges of the sheet light becomes weak. The fine particles are
linearly aligned in the vertical direction as shown in the red dashed lines
in Fig. 1. They are, however, not linearly aligned in the horizontal direction
as shown in the yellow dashed lines. Although we cannot be sure since it was
observed from a single direction, it looks like a face-centered or body-centered
structure. We plan to improve the observation instrument to reveal the structure.
On the other hand, the figure shows that the vertical intervals of particles
are smaller in the upper side and the number of particles in the vertical direction
is around five to six. This is because electric field of sheath area is used
to hold the Coulomb crystals against gravity. If we use a microgravity environment,
we should obtain Coulomb crystals that are isotropic and large without influence
of the sheath.
 |
 |
 |
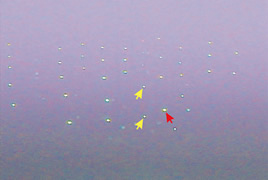
| (a) Initial state |
|
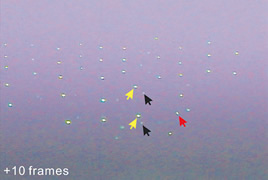
(b) 10 frames later |
 |
|
 |
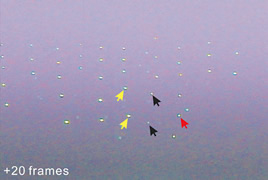
| (c) 20 frames later |
|
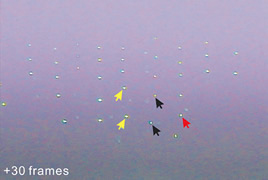
(d) 30 frames later |
|
| Figure 2. In-situ observation results of Coulomb crystal growth |
The Coulomb crystals produced at JAXA have a tendency for
particles in the lower side to move more actively than those in the upper side.
Therefore, the phenomenon where particles in the lower side move to different
lattice points is observed. Fig. 2 shows an example of this movement. Fig. 2
(a) is the initial state. Fig. 2 (b) is 10 frames (about 0.33 sec.) after (a),
where the particles indicated by the black arrows were nearing the sheet light
plane. At that time, the particle indicated by the red arrow was moving right
while the yellow-arrowed ones were moving left. In Fig. 2 (c), 20 frames later,
the black-arrowed particles neared the lattice where the red-arrowed particle
had been combined at the initial state. Meanwhile the red-arrowed particle and
yellow-arrowed particles were combined with the lattices on the right and left
side respectively of their original lattices. In Fig. 2 (d), 30 frames later,
the black-arrowed particles were combined with the lattices, too. The reason
for using the term “combine” is that the particles show behavior identical
to being trapped by potential wells when positioned at lattice points after
movement. We plan to elucidate this trapping mechanism by integrating models
and experimental results. There are few reports on this behavior. We expect
that our research results can be used to model surface diffusion, etc., of the
existing crystals in future.
|
|