
The X-ray Background - a 40-years mystery
The X-ray background, strong radiation observed from every
direction in the entire sky, was discovered by Dr. Riccardo Giacconi and his collaborators
at the birth of X-ray astronomy. The cosmological importance of the radiation
was clearly recognized at that time and revealing its origin has been a primary
theme of X-ray astronomy for over 40 years. The energy spectrum of the X-ray background
has a peak around 30 keV, and the most of its energy is emitted at photon energies
above 2 keV (the hard X-ray background). Pre-ASCA surveys in soft X-ray band detected
mainly unabsorbed AGNs (Type 1 AGNs). Their spectrum is, however, far softer than
that of the X-ray background. Thus, it proved impossible to explain the origin
of the X-ray background by a superposition of emission from the same type of objects.
This contradiction is known as the "spectral paradox", and has been
one of the biggest mystery in the pursuit of the origin of the X-ray background.
Using ASCA at its then-highest sensitivity in the hard X-ray band, we conducted
a survey observation of a continuous region covering seven square degrees in the
direction of the Coma Berenices for several periods from 1993 to 1995: the ASCA
Large Sky Survey (ALSS). Consequently, we resolved about 30% of the X-ray background
in the 2-10 keV band into discrete sources and discovered a population of X-ray
sources with hard spectra, which are considered the main contributors of the X-ray
background. We find evidence that they are heavily absorbed and, as a result,
the average spectrum of faint X-ray sources is significantly harder than that
of Type 1 AGN. Further, we succeeded in optically identifying all the 33 X-ray
sources detected in the energy band above 2 keV. Interestingly, we found that
most of the absorbed X-ray sources exist in the relatively nearby universe at
redshifts less than 0.5.
At around the beginning of the ALSS project, we started close, strong joint research
with optical astronomers represented by Masayuki Akiyama (the National Astronomical
Observatory of Japan; NAOJ), Koji Ohta (the Faculty of Science, Kyoto University),
and Toru Yamada (NAOJ). The collaboration continues to this day. The central galaxy
in Fig. 1 is the optical image of an AGN discovered in the ALSS project, taken
with the SUBARU telescope. The error circle of the X-ray source is shown in the
small figure upper left, taken with the University of Hawaii 88-inch telescope.
As you can imagine, optical identification is not a smooth process. It is a struggle
against the position accuracy of ASCA sources, which has been improved to 20 arcsec
by the final calibration. The identification process is something like work by
skilled craftsmen. We had to make real-time judgments and seek the most efficient
way to identifying as many sources as possible within the limited time of the
telescope. Like a band of guerrillas, we visited observatories around the world.
Looking for more quantitative evaluation, our research moved forward to the much
larger area survey, the ASCA Medium Sensitivity Survey (AMSS). Using all the archive
data of ASCA, we systematically search serendipitous sources that came by chance
into the GIS detector's field of view. Naturally, this required the analysis of
a huge amount of data. Finally we were able to publish the results as an X-ray
catalog, although, for a certain period of time, our almost total occupation of
the X-ray group's computer caused trouble to others. We then defined a flux-limited,
hard-band selected sample from this catalog and initiated a systematic optical
identification program. This project took several years. Recently we have succeeded
in optically identifying about 100 X-ray sources almost completely. The area covered
by the AMSS is still the largest in the world, providing a unique X-ray sample
compared with other surveys.
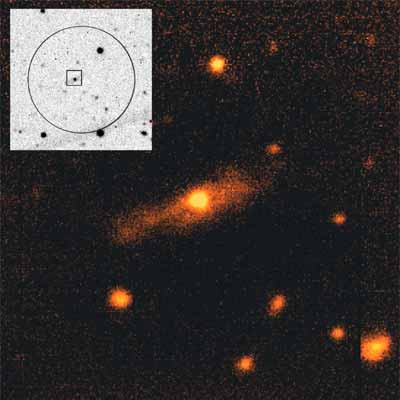
Fig. 1 Example of the optical image of an AGN discovered
by the ASCA hard X-ray survey
(the galaxy in the center is the object in question).
Taken with the Subaru telescope's Supreme-Cam. Image circled is a finding chart
taken with the University of Hawaii 88-inch telescope.
|