
Solar magnetic field
The solar atmosphere is governed by energetic processes of different size, from small scale events of a few kilometres to larger ones of several thousand kilometres that appear scattered on the solar surface (see black colour in Figure 1). Although we do not completely understand the nature of these active phenomena yet, the scientific community agrees on that they are always related to the magnetic field, ubiquitous in the solar atmosphere. This magnetic field displays a simple configuration in the majority of the solar surface but is very complex inside solar active regions, known as sunspots, where it can be larger than 3000 G (0.3 Tesla). Although this value could seem not so high compared to the ones we can obtain with modern electromagnets, we should bear in mind that sunspots can be even larger than the Earth! These colossal magnetic structures usually appear as rounded features with a dark central core, i.e. the umbra, surrounded by a brighter filamentary structure called penumbra (see Figure 2). If a sunspot is present in the Sun, there is a high probability that it erupts producing an explosion called flare that ejects solar plasma to space. Moreover, depending on the magnitude of this explosion, the ejected plasma can even harm our electronic devices that orbit around the Earth and therefore is crucial to understand the nature of these processes.
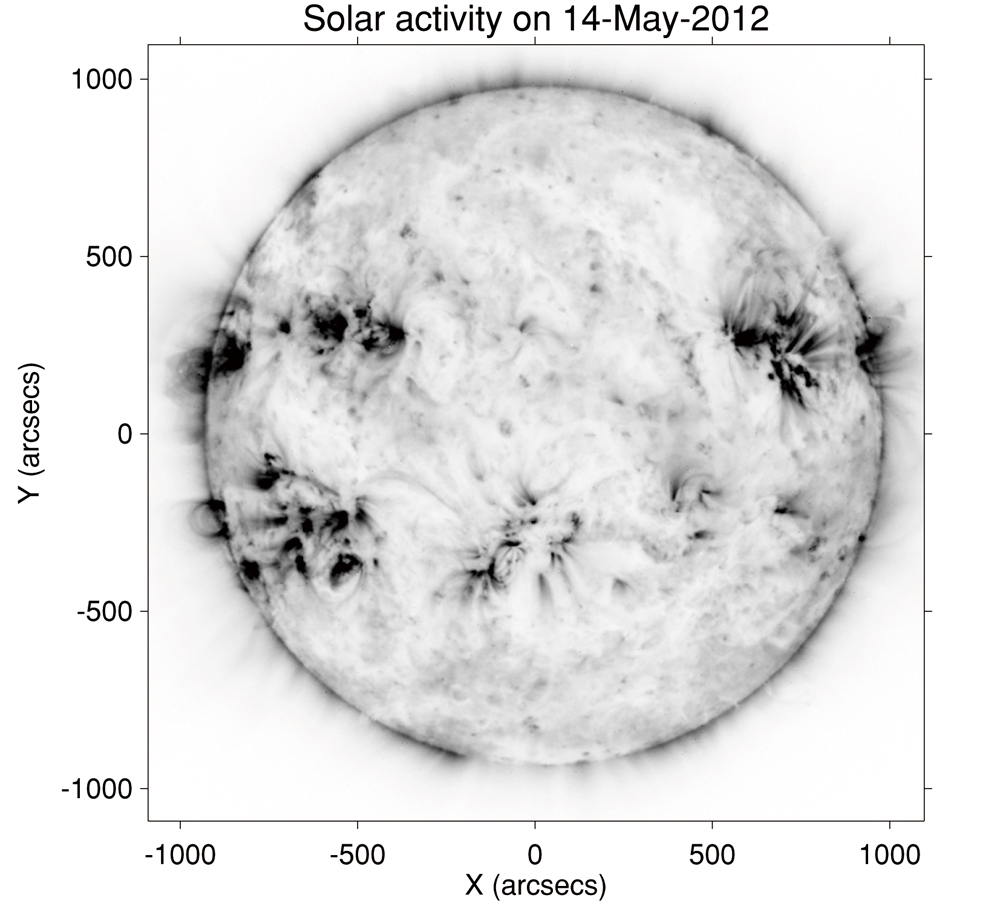
Figure 1. Magnetic activity on the solar surface, black colour. This observation was taken by the PROBA2 mission and corresponds to the period called solar maximum that is characterised by the presence of multiple active regions every week. Regarding the spatial scale, 1 arcsec is equal to about 725 km in the Sun.

Figure 2. Solar sunspot observed with the spectro-polarimeter on board Hinode on 2007 April 30th. It was a relatively large active region (several times larger than the Earth) that lasted more than two weeks.
Spatial deconvolution methods
Modern solar telescopes observe the Sun and collect photons with a digital camera, similar to the one we have on our smartphones. These photons are produced in the solar atmosphere and interact with the solar plasma in their way to us. Therefore, they can provide information about the solar atmosphere, for instance, they can tell us how hot is the plasma, how fast it moves or how magnetised it is. However, to obtain the information of the solar magnetic field we need to measure the degree of polarisation of the sunlight. In this regard, the spectro-polarimeter on board Hinode satellite was designed to periodically measure at different wavelengths the degree of polarisation of the light that is produced in the lower part of the solar atmosphere. The data provided by this instrument are excellent, and they have significantly promoted our knowledge of the physics of the Sun, something that impelled me to travel from Spain to the far east for joining the Hinode team. An opportunity that I could only dream until it came true!
However, even a space telescope as Hinode that observes the Sun without the influence of the Earth's atmosphere is still affected by instrumental effects as the so-called stray light that produces a dispersion of the light from different parts of the image. In order to correct this effect and to improve the quality of the spectro-polarimetric observations, new numerical techniques known as spatial deconvolution methods, have been developed in the past fifteen years. One of these methods was recently created by Dr. Asensio Ramos, a young solar physicist that works in Spain. The method, explained in detail on Quintero Noda et al. (2015), has been extensively tested on Hinode data during the last two years where I studied different physical events allowing the publication of 4 referred papers during my first year working at ISAS.
We can see in Figure 2 an example of what we can achieve thanks to the spatial deconvolution method. The left part of the image shows the original data, affected by the stray light contamination, while the right side of the image displays the result of the spatial deconvolution method. The latter shows a greater quality where solar elements are more defined and the contrast between dark and bright features has been enhanced. Moreover, it allows improving the characterization of complex structures that rapidly vary on short spatial scales such as the filaments that composed the penumbra (see Figure 2 and also the cover figure) as it largely enhances the intensity fluctuations between them.
In addition, the spatial deconvolution has improved our understanding of small scale events that are close to the telescope maximum resolution. This is because it allows the visualisation of structures that are blurred by the telescope's stray light. As an example, we can see in Figure 3 that the right panel (deconvolved data) shows a large number of bright points located in the dark narrow areas that were very faint, or indistinguishable, in the original data (see coloured arrows). These bright points correspond to regions of strong magnetic field and we were able to properly detected them in Quintero Noda et al. (2015) thanks to the spatial deconvolution. Finally, we would like to remark that this code is friendly user and works with data from any telescope (even ground-based telescopes), so anyone interested in using it is welcome to do it as it is a free software for public use.
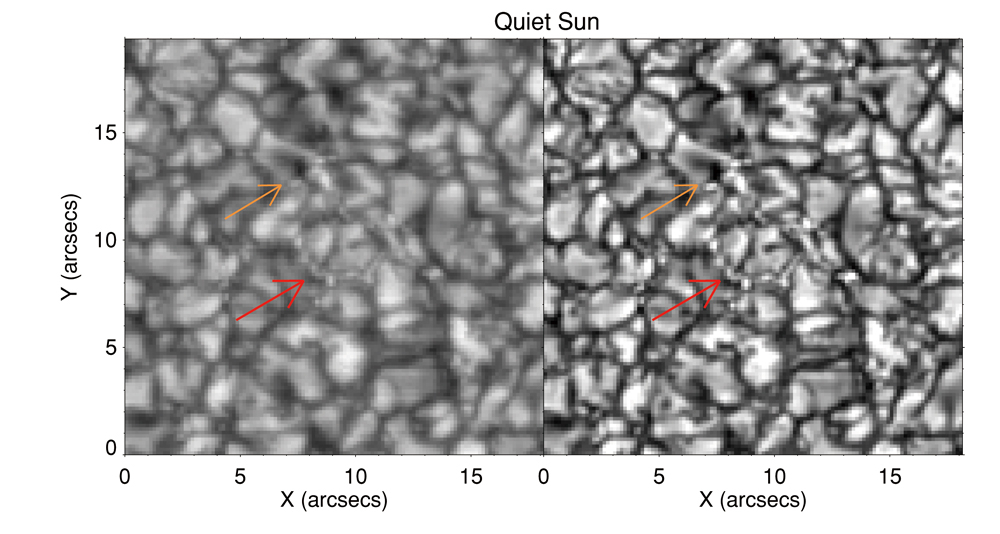
Figure 3. Quiet Sun region observed on 2007 April 21st. The smallest bright points (see arrows) correspond to locations of strong magnetic field and were studied on Quintero Noda et al. (2015).
The inversion code SIR
Inversion codes aim to retrieve the physical information contained in the observed photons. They solve the Radiative Transfer Equation (RTE) for the polarised light to create a synthetic spectrum that matches the observed one. In that sense, they iteratively change the physical information used in the RTE until a good fit is achieved. However, this is a complex task and early inversion codes had to assume several theoretical approximations that simplified the process and the computational time. In this regard, they were able to determine the information of the atmospheric parameters only at a fixed height in the solar atmosphere. However, in the early nineties two pioneer researchers, Dr. Ruiz Cobo and Dr. del Toro Iniesta, developed a new inversion code called SIR (Stokes Inversion based on Response functions) that allowed surpassing the mentioned limitations. The code was based on a new theoretical approach and permitted, for the first time, to infer the physical information of the solar atmosphere at different heights. Therefore, we can determine vertical gradients on the temperature or magnetic field vector for example what allows to understand better the Sun and the phenomena that take place at higher heights in the solar atmosphere. In addition, these results can be compared with complex theoretical models and simulations, areas where the physics of the problem is well understood. For these reasons, this work supposed a breakthrough in the understanding of the solar magnetism and is still used nowadays. For instance, there are more than 200 publications in the last ten years where SIR has been applied on Hinode spectro-polarimetric data.
We show in Figure 4 an example of the possibilities of the SIR code. We plotted the vertical stratification of the plasma temperature and magnetic field strength. The horizontal dimension corresponds to the pixels highlighted in red in Figure 2 while the vertical axis shows different geometrical heights in the solar atmosphere. We can see that the plasma temperature is always hotter at the bottom of the atmosphere and it decreases with height, something that we expected as the majority of energetic processes that take place in the Sun occur in the core of the star. Regarding the spatial distribution, i.e. if we follow the red line in Figure 2, we found a region that is extremely cool, dark colour, that corresponds to the sunspot umbra and barely changes with height. Additionally, outside this region, we always detect a fluctuation at the bottom of the atmosphere that corresponds to the bright and dark features in Figure 2 and 3. Moreover, we can also identify a complex behaviour at higher layers where hot threads (white colour), related to the solar activity, sometimes appear. Lastly, the magnetic field strength (bottom) is strongly correlated with the spatial distribution of the temperature, being extremely large where the latter is very low (at the umbra) and showing a complex fluctuating pattern for the rest of the spatial locations.

Figure 4. Height stratification of the temperature (top) and magnetic field strength (bottom) for the pixels marked with the red line in Figure 2. The geometrical height starts approximately at the beginning of the visible solar surface.
Towards a better understanding of the Sun
The key for understanding the physics of the solar atmosphere is to perform spectro-polarimetric observations of the Sun. This has been extensively proved by Solar-B (Hinode) and it is also an important aspect for future solar observatories as the Solar-C space mission. If we have available spectro-polarimetric observations of the Sun we can take advantage of inversion codes to translate the information contained in the observed spectrum to physical information of the solar atmosphere. In addition, if we apply a spatial deconvolution method to these observations we can remove instrumental effects what will improve the image quality, the detection of small scale features, and the results of the inversion code, among others. In that sense, I have been working these last two years combining for the first time these two techniques on observations of different solar regions, taking advantage of the symbiotic relationship between both techniques. I have demonstrated that they accurately work and allow extracting the physical information contained in the observed data what help us to understand a bit better the solar atmosphere. Therefore, we have available right now the tools that will help us to tackle further than never before the nature of the Sun, the star that rules our life and we depend on.
Appendix
Polarization degree of a sunspot region (see also Fig. 2 of the article) obtained with the spectro-polarimeter on board Hinode on 2007 April 30th. Left panel shows the total linear polarization degree that is proportional to the magnetic field component parallel to the solar surface. On the other hand, right panel shows the circular polarization degree that is related to the magnetic field component perpendicular to the solar surface. White colours indicate very low polarization values while darker colours correspond to stronger magnetic fields. Using these observations we can fairly trace the magnetic field strength and orientation. We can see that it is very strong and vertical respect to the solar surface in the central part of the structure (right panel) and as we move away to its edges the magnetic field becomes more and more inclined respect to the solar surface (left panel).
(Carlos Quintero Noda)
ISAS News: October 2016 issue