


TOP > Report & Column > The Forefront of Space Science > 2012 > Changes in Brightness and Color of the Moon by Observing Angle
![]()
Utilization of our research results The ability to perform photometric correction of the moon with high accuracy will help us to make scientific analysis using SP data. Moreover, it is useful for other observations in which wavelength regions overlap. Coefficients obtained from SP have already been used to perform photometric correction of imagery from a Multiband Imager onboard the KAGUYA. Our result is also applicable to the photometric correction of data retrieved from other lunar explorers. In the meantime, the data combined with lunar-reflectance data or the photometric correction formula by SP can be used for other planetary explorers and earth-observation satellites. Planetary explorers sometimes carry out performance checkups of their onboard optical instruments using the moon when they make a lunar swingby. Similarly, earth-observation satellites orbiting the earth sometimes conduct observation of the moon to check secular changes in performance by turning themselves over. Until now, there is a limit in forecasting brightness of the moon at any given lunar surface, phase angle, or wavelength. The SP data is expected to improve the forecast, eventually contributing to a wide range of observation by explorers in the future. Map of the entire moon Lastly, we would like to introduce a by-product of our research. As a part of the adaptability confirmation of our correction method, we produced reflectance maps of the entire moon per band at meshes of Lat./Long. 1 deg, 0.5deg., etc. Width of Lat./Long. 1 deg. is equivalent to about 30km at the lunar equator. Although SP is not a camera, we were able to create image maps of the entire moon by collecting the data of each mesh observation. Wavelength range of the maps is from 0.51 to 1.65µm, in which 160 bands are included. The image here (0.5 deg. mesh) is made of a combination of four bands (0.51, 0.75, 0.95, and 1.55µm), which stresses the colorsEwhen seeing the moon in visible and near-infrared light. Shadows of the terrain data retrieved by KAGUYAs laser altimeter are also overlapped in the images. It can be seen that the lunar surface has various color variations. We had a surprise when we saw the maps we produced. We discovered that areas where gradient of reflection spectrum is gentle compared to the average (i.e. relatively blueEregion) are densely distributed in the high-latitude regions more than 75 deg. in the north and south of the moon (Fig. 2). In the past, many researchers thought that this must be an error in correction.EHowever, we now believe that this is a real feature of the moon. BlueEmeans that space weathering (a phenomenon where spectral features change due to solar wind, collision of micrometeorite, etc.) stays at a low level. Why does this happen? It is hard to think that the high-latitude regions have been selectively dug by meteorites and are covered with new emerging surfaces. It is possible that the rate of space weathering is slower in the high-latitude regions compared to other regions. It is believed that protons, which are carried by the solar wind, play a role in space weathering. Since the lunar high-latitude region is highly oblique to the sun, it is no wonder that supply density of protons is low compared to other regions. We plan to study in more detail the distribution of the blue regions and explore the relationship between the regions and space weathering. 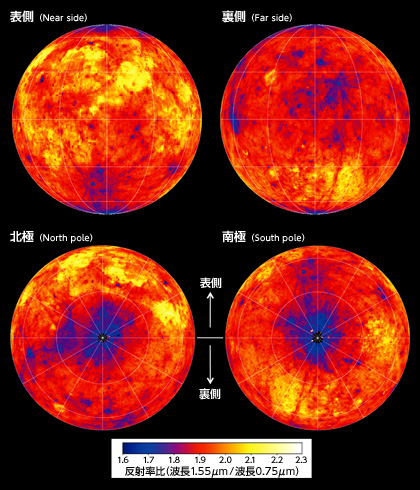
Yasuhiro YOKOTA / Tsuneo MATSUNAGA
|
||||||