TOP > Report & Column > The Forefront of Space Science > 2012 > Changes in Brightness and Color of the Moon by Observing Angle
![]()

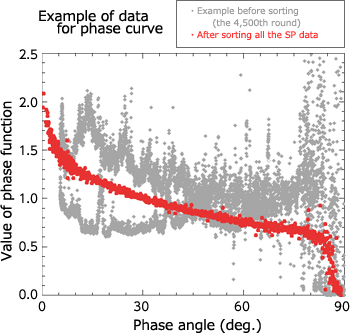
Analysis of observation data from KAGUYAs SP The SP onboard KAGUYA observed the lunar surface from its orbit of an altitude of 100 km with approx. 500m instantaneous field of view and with an interval of several nm (1nm = 1µm/1,000) in the wavelength region of approx. 0.5µm to 2.6µm. While KAGUYA went around the moon about 7,000 times over 20 months, SP retrieved the spectroscopic observation data (reflected light intensity of respective wavelengths) of about 70 million places. The traditional practical correction method is for wavelength shorter than 1µm and, moreover, only for several bands with intervals. Since we needed a phase curve useable for respective SP observation wavelengths, we determined to obtain a phase curve from the SP observation data itself. The phase curve of photometric correction is one showing relation between phase angle and brightness of lunar surface. By putting the reflected light intensities observed in the order of phase angle, we can obtain its empirical curve form. However, since reflected light intensity is also affected by the distribution of the lunar surfaces reflectance, a technique is required to retrieve a phase curve form a single datum of reflected light intensity. Furthermore, the correction method for data at low-solar altitude was one of the problems. In the past, multi-band imagery by the U.S.s Clementine explorer, which observed the moon in 1994, have been widely used in the field of reflection spectrum research of the moon. Analysis of Clementines data for the lunar high-latitude region (i.e., place of eternally low solar altitude), however, has been hampered by a problem of photometric correction. At the high-latitude region more than 60 deg., for example, reflectance was about 20% higher than expected, so it was reported that the reliability was doubtful. As for the lunar South Pole, the possibility was also pointed out that its color looked strange because of correction error. Similarly, our research faced problems of regional bias in reflectance distribution and low-solar altitude data. Initially, we intended to obtain the phase curve by putting in the order of phase angle the SP data of a certain orbit observing from the equator to the North Pole on the far side of the moon. In the phase curves obtained by this method, however, was a strange one where the values were higher than expected in the phase angle over 70 deg. (Fig. 1). These data were retrieved from the high-latitude region. SP can only observe the high-latitude region with a large phase angle, so we were unable to determine whether this was the correct phase curve or error caused by reflectance distribution on the lunar surface. 
To solve the problem, we took a different approach. We restricted the analysis area to the place where observation data of or around the referenced phase angle (30 deg.) were available. In addition, we selected in advance the region where reflectance was almost the same based on the observation of the referenced phase angle. With this approach, the region to be analyzed can be narrowed to the equator side from approx. latitude 40 deg. We split the lunar surface of the region into about 50 levels of reflectance using the observation data of 0.75µm wavelength. In addition to eliminating the influence of reflectance distribution, another reason for grouping by reflectance is that reflectance dependency is seen in the phase curve shape. Difference in curve shapes becomes evident around the latitude 20 deg. area where a phenomenon called opposition effect (i.e. the lunar surface becomes bright suddenly as the phase angle becomes small)Eemerges. Finally, we compiled the phase angle data into three groups by reflectance (Fig. 1). The three groups correspond to highland,Esea,Eand area in between highland and sea.EBy obtaining the data in other wavelengths, we were able to show in detail that the lunar opposition effect has reflectance dependency. We also discovered that the opposition effect appears particularly at and around 1µm wavelength, which corresponds to absorption bands of mineral reflectance spectra. The accuracy of the photometric correction using this phase curve was verified by sampling the SP data of the same lunar surface observed twice or more. Even if observation date and observation angle are different, the values after correction of this approach agree within 2%. However, the difference in sea observation at large phase angle exceeds 2%, which is an issue we should clear in the future.
|
||||||


