► Japanese
| Pulsar and Neutron Star | Crab |
| Pulsar and Neutron Star | PSR1509-58 |
| Prepared by | Date |
|---|---|
| Ken Ebisawa | 2008-12-25 |
Crab Nebula is a remnant of the supernova explosion occurred in 1054 AD. The Pulsar is a revolving Neutron Star located at the center of Crab Nebula. The Pulsar has magnetic poles as the earth does. But, the magnetic field strength of the Pulsar is about 1 trillion times as strong as that of the earth. The Pulsar is blinking like a beacon lamp, as two magnetic poles appear and disappear by turns. The revolving period of the Pulsar is found to be 0.03357701 (sec) by the precise measurement.
Store data in the file crab.fits. In a usual case, using the right button click on "store the linked file with an alias", you can store the file. Those are the real data of Crab Pulsar that the Suzaku observation satellite collected on Sept.15 2005. A part of the data, which is not required for this practice, is eliminated from those data. In the field of astronomy, the standard data format is the FITS format. Those Suzaku collected data are all written in the FITS Format. Let's use "fv" program to handle the FITS file and take a look at the data file. Choose "Open File" in the main menu of "fv" program, and indicate the file name "crab.fits".
That file is divided into three extensions. In the "EVENTS" extension, the X-ray data are stored. Choosing "All" on the right of "Events", you can see the contents of the "EVENTS" extension.
The detection times of the X-ray photon are written in a column called "TIME". The origin of the detection time is the starting time of the observation.
In a window displayed as "Binary Table of crab.fits[1]...", choose
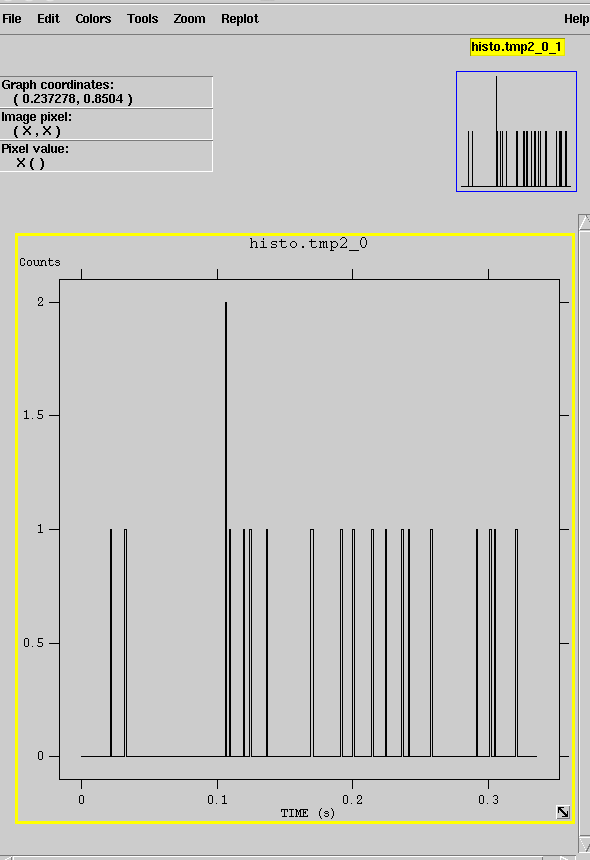
Tools --> Histogram...Specify "TIME" in "column Name" on the X axis and leave the Y axis "space", when a new window called "fv:Histogram" is opened. Input Min=0, Max=0.3357701 (10 periods), and binsize=0.001. Then, click "Make". A diagram or a plotted right curve is displayed as shown below. In the diagram, the X axis indicates the elapsed time from the observation start, and the vertical axis indicates the number of the X-ray photon per "bin". "bin" is one unit period which means each time interval on the evenly divided time axis.
Will you understand how the Pulsar blinks 10 times in each period ?
You will not understand it by that fact only. The reason is that the number of photons collected by the detector is not enough. "binsize=0.001" means that the time "bin" width is 0.001 (sec). It is clear that only 0, 1, or 2 photons can be detected in 0.001 (sec). It is not possible for everyone to see any pulse in such a short period. How can we obtain the better pulse image ?
The time period from beginning to end in this observation, is about 22000 seconds. In this observation time period, the pulsar will revolve over 650000 times. If you superpose the intensity curve per one revolving period for 650000 revolving periods, you can obtain the same effect as you have observed the 650000 time brighter pulsar in one period. Now, let's see that image.
From the beginning of the observation, you must count the number of pulses "N" at the time when each photon reached. To do this, you just divide the arrival time "TIME" of each photon by the period "0.03357701". Please note that "N" is a real number.
Then, go back to the window displayed as "Binary Table of crab.fits[1]...", and choose
Tools --> Calculator...Type in "N=TIME/0.03357701" on the box above, and click "Calculate" on the right of the window. You will see that "N" is added to the "Binary Table of crab.fits[1]..." window. Please note that "N" is a real number. The decimal part of "N" will take numbers from 0 to 1, and mean the phase. The phase of each photon shows where the photon is detected in the pulse. Let's obtain the phase data and put them onto a new column.
In the "Calculator" window, type in "Phase=N-floor(N)", and click "Calculate". You can see that the new column called "phase" is added to the window "Binary Table of crab.fits[1]...". You can also see the phase having the decimal part of "N".
Let's set the phase in the proper range, and superpose 650000 revolving periods.
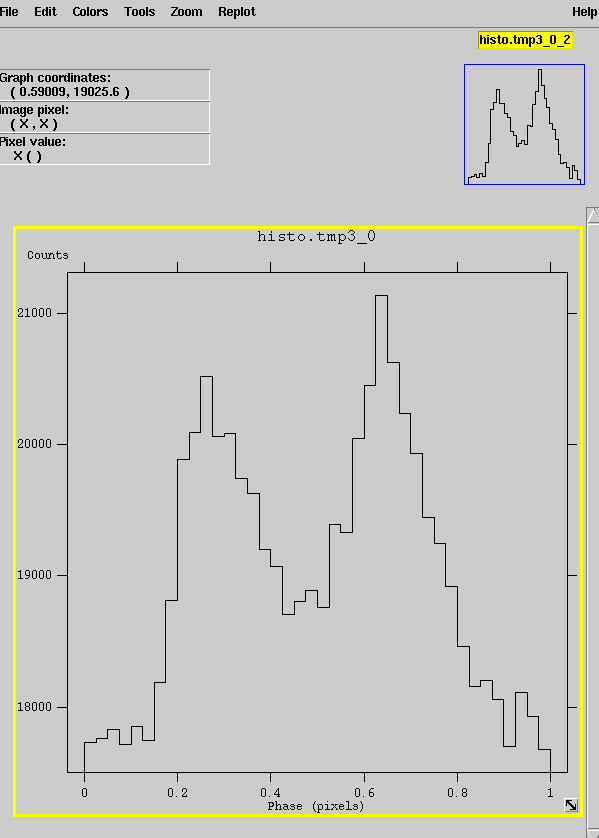
Now, go back to "fv:Histogram" window. Choose "Tools --> Histogram..." in the window displaying "Binary Table of crab.fits[1]...", if you have already closed "fv:Histogram" window. Specify "Phase" to the X-axis, and click "Make", after the parameter (Min=0, Max=1.0, and bin-size=0.025) inputs. Then, a plot called "X-ray Photon" is displayed. This plot is a right curve folded by periods. Since 0.03357701 (sec) period is divided by 0.025 phase bin, the length of one phase bin is 0.00084 (sec). See the vertical axis of the plot. It tells that there are 18000 to 21000 photons in one phase bin. As the Pulsar revolves in one period, two magnetic poles appear and disappear by turns. That fact tells that there exist two peaks.
Next, let's do the analysis of the pulsar called PSR1509-58. The abbreviation PSR1509-58 means "Pulsar", 1509 means the celestial longitude, and -58 means the celestial latitude. Store PSR1509-58 data collected by the Suzaku observation satellite, to PSR1509-58.fits file.
The period of this pulsar is about 0.151364 (sec). The elapsed time between the observation start and its end is 126000 (sec). As described in the above Crab Pulsar example, the wave form of the pulse will appear clearly, using the pulse period superposition of data. Let's consider how precisely the pulse period can be determined.
Assuming that P is the period and T is the time between the observation start and its end, there are T/P pulse in that time period. Now, N is a number of pulses. Using the correct period, the correct wave form will be obtained after N pulses are superposed. If a different number, which is a little bit shifted from N, is used for the superposition, the phase is also shifted and the wave form is collapsed. The pulse shifting ΔN is going to influence the degree of precision ΔP for the period determination.
From
NP=TAssuming T is fixed, it is clear that
ΔN P + N ΔP = 0After changing the equation, the following equation is obtained.
ΔP = - ΔN P/N = - ΔN P2ˇˇ/T.
This equation gives the relation between the shifting from the correct number of pulses ΔN and the shifting from the correct period ΔP. It is not determined clearly which value must be taken for ΔN. Considering the fact that the wave form will collapse in the half period shifting, it had better take the value 1/2.
ΔP = - (1/2) P2/T.
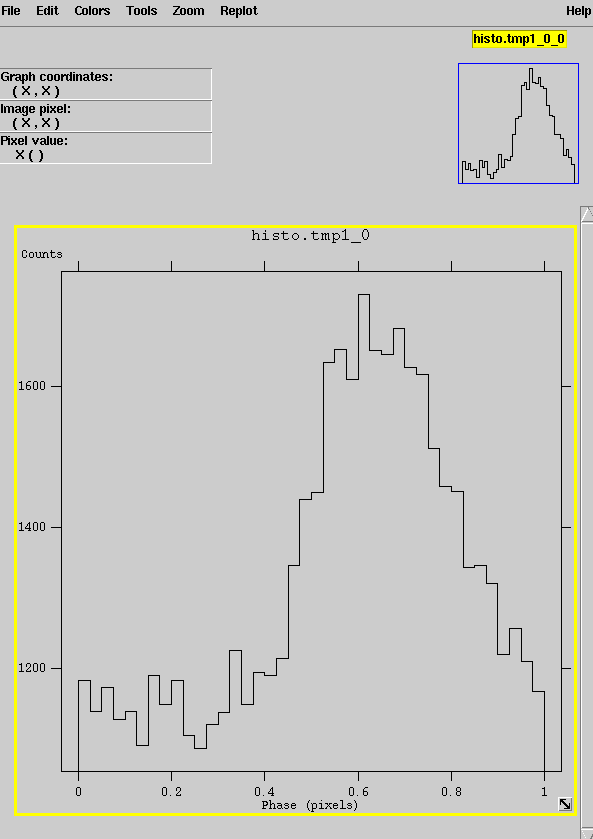
In this example, since P is about 0.151364 (sec) and T is 126000 (sec), the expecting precision ΔP is ~9x10⁻⁸ (sec). It is about 10-7 (sec). If the period of the pulsar is 0.151364? (sec), the location of decimal ? can be determined. However, the period of the pulsar cannot be determined precisely more than that decimal location. Let's set one of figures 0 to 9 on "?", and superpose the data to obtain the correct period. The correct answer is the period in which the clearest superposed pulse wave form is displayed. Did you obtain the following pulse wave form, didn't you ? The answer is 0.1513648 (sec).
 [an error occurred while processing this directive]
Last Modified: 24 April 2012