Images
Last Modified:
Please enjoy beautiful images taken by great observatoris and scientists.
ASCA, X-ray
Coiped from Furusho et al. 2001 ,
about 2 deg x 2 deg,
ASCA kT map,

original caption:
Color-coded temperature map of the Perseus Cluster obtained from ASCA multipointing observations. The contours indicate the residual PSPC image after subtraction of a ā└-model, and Rvir is calculated to be 3.3 h Mpc for kT = 7 keV, assuming the virial radius given as R180 = 1.23(TX /1 keV)1/2 h Mpc by Evrard, Metzler, & Navarro (1996).
Chandra, X-ray
Copied from Fabian et al. 2006
Chandra
 original caption:
Fig.2: Unsharp mask image made from the whole 0.3\x{2013}7 keV band by subtracting an image smoothed with a Gaussian of dispersion 10 arcsec from one smoothed by 1 arcsec and dividing by the sum of the two images. Various features are labelled in the lower contrast image at the left-hand side.
original caption:
Fig.2: Unsharp mask image made from the whole 0.3\x{2013}7 keV band by subtracting an image smoothed with a Gaussian of dispersion 10 arcsec from one smoothed by 1 arcsec and dividing by the sum of the two images. Various features are labelled in the lower contrast image at the left-hand side.
 original caption:
Figure 3. Colour image made from the 0.3\x{2013}1.2 (red), 1.2\x{2013}2 (green) and 2\x{2013}7 keV (blue) bands. A 10-arcsec smoothed image has been scaled to 80 per cent of its intensity and then subtracted in order to bring out fainter features lost in the high-intensity range of raw images. The blue structure to the N of the nucleus is caused by absorption in the infalling high-velocity system, projected at least 60 kpc in front of the nucleus of NGC 1275 (Gillmon, Sanders & Fabian 2004).
original caption:
Figure 3. Colour image made from the 0.3\x{2013}1.2 (red), 1.2\x{2013}2 (green) and 2\x{2013}7 keV (blue) bands. A 10-arcsec smoothed image has been scaled to 80 per cent of its intensity and then subtracted in order to bring out fainter features lost in the high-intensity range of raw images. The blue structure to the N of the nucleus is caused by absorption in the infalling high-velocity system, projected at least 60 kpc in front of the nucleus of NGC 1275 (Gillmon, Sanders & Fabian 2004).
 original caption:
Figure 4. Temperature map calculated by fitting spectra with approximately 625 counts or greater. The uncertainties of the individual fits range from 8 per cent in the coolest regions to 20 per cent in the hottest parts, ignoring the uncertainty on the metallicity and absorbing column density.
original caption:
Figure 4. Temperature map calculated by fitting spectra with approximately 625 counts or greater. The uncertainties of the individual fits range from 8 per cent in the coolest regions to 20 per cent in the hottest parts, ignoring the uncertainty on the metallicity and absorbing column density.
XMM-Newton
Copied from Churazov et al. 2003
 Fig.1 Surface brightness contours in the 0.3\x{2013}5 keV energy range (corrected for the background and telescope vignetting) superposed onto a Digitized Sky Survey optical image (30' ü~ 30'). The X-ray image has been smoothed with an 8'' Gaussian. The central galaxy is NGC 1275. A chain of bright galaxies is visible to the west.
 Fig.7 Relative deviation of the surface brightness from the azimuthally averaged value. The image shown is 30' ü~ 30'. Clearly seen are the region of excess emission to the east from the center, an edgelike structure 5'\x{2013}7' to the west from the center, and complicated structure in the inner 1'\x{2013}2' region.
 Fig.9
Gas temperature map (30' ü~ 30'). The temperature is derived from adaptively smoothed data with an effective number of counts within each smoothing window of ~104. Contours show the surface brightness distribution.
Fig.9
Gas temperature map (30' ü~ 30'). The temperature is derived from adaptively smoothed data with an effective number of counts within each smoothing window of ~104. Contours show the surface brightness distribution.
HST
Copied from Fabian et al. 2008, Nature,
HST, optical, 140 x 150 arcsec.
 original caption:
This image was created by subtracting a scaled green (F550M) image from the red image, removing the smooth galactic continuum contribution. The image measures 140 times 150 arcsec in size. Multiple exposures using a three-point line dither pattern were taken at a set of three pointing positions around the centre of NGC 1275 in filters F550M and F625W, with considerable overlap between the pointings. Similar data (see Supplementary Information) were obtained in the F435W filter, but from only two pointing positions because of the failure of ACS before the completion of this programme. The data from each filter were registered relative to each other using stars, and then combined separately into large mosaic images using the latest version of the stsdas task multidrizzle18.
original caption:
This image was created by subtracting a scaled green (F550M) image from the red image, removing the smooth galactic continuum contribution. The image measures 140 times 150 arcsec in size. Multiple exposures using a three-point line dither pattern were taken at a set of three pointing positions around the centre of NGC 1275 in filters F550M and F625W, with considerable overlap between the pointings. Similar data (see Supplementary Information) were obtained in the F435W filter, but from only two pointing positions because of the failure of ACS before the completion of this programme. The data from each filter were registered relative to each other using stars, and then combined separately into large mosaic images using the latest version of the stsdas task multidrizzle18.
Optical
copied from APOD/20080520 by NASA.
original caption:
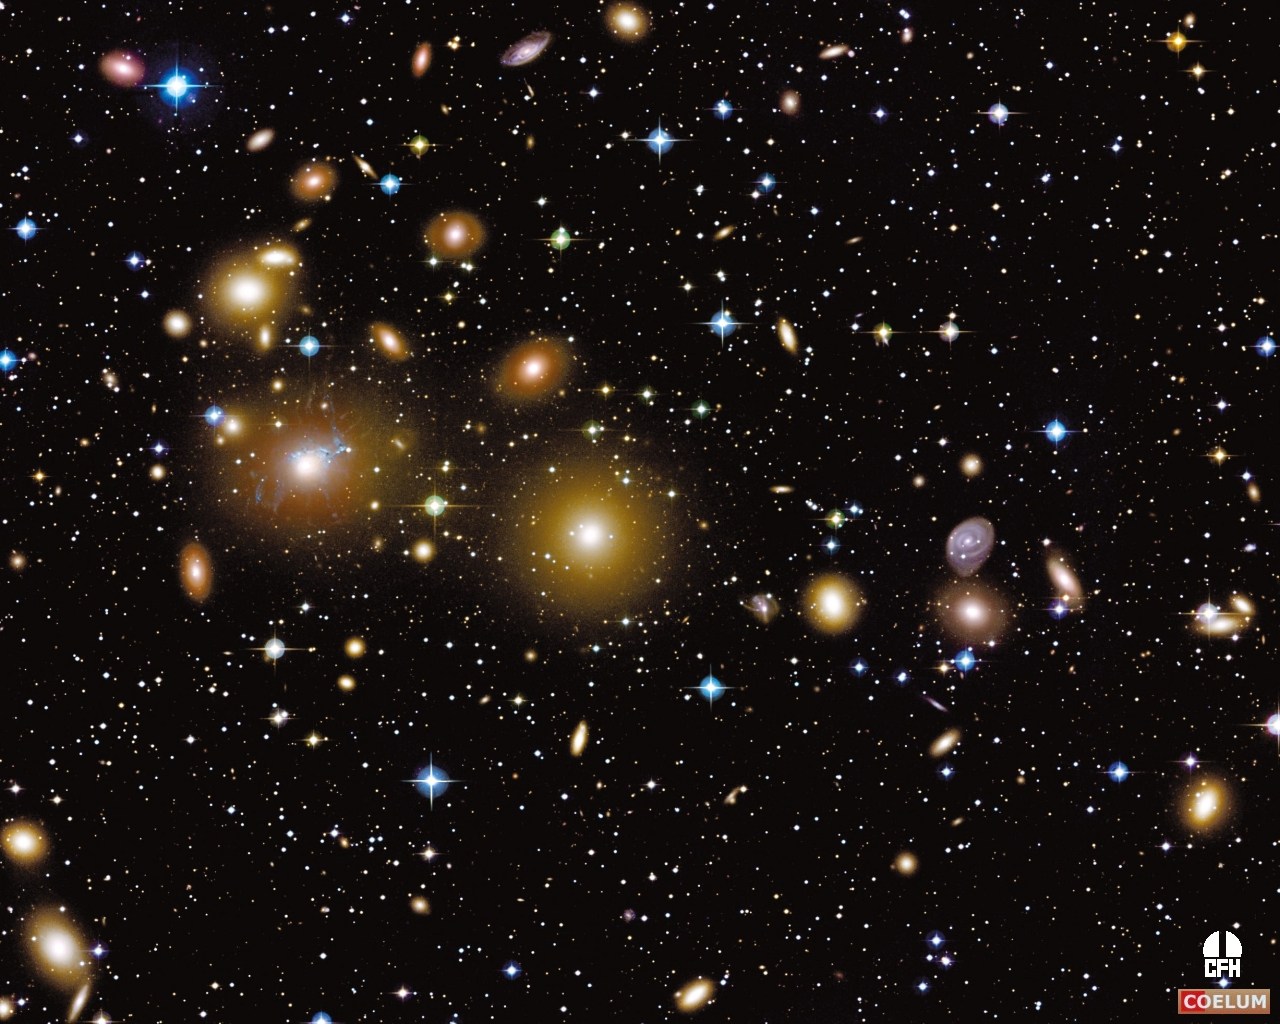
Explanation: Here is one of the largest objects that anyone will ever see on the sky. Each of these fuzzy blobs is a galaxy, together making up the Perseus Cluster, one of the closest clusters of galaxies. The cluster is seen through a foreground of faint stars in our own Milky Way Galaxy. Near the cluster center, roughly 250 million light-years away, is the cluster's dominant galaxy NGC 1275, seen above as the large galaxy on the image left. A prodigious source of x-rays and radio emission, NGC 1275 accretes matter as gas and galaxies fall into it. The Perseus Cluster of Galaxies is part of the Pisces-Perseus supercluster spanning over 15 degrees and containing over 1,000 galaxies. At the distance of NGC 1275, this view covers about 7.5 million light-years.
 original caption:
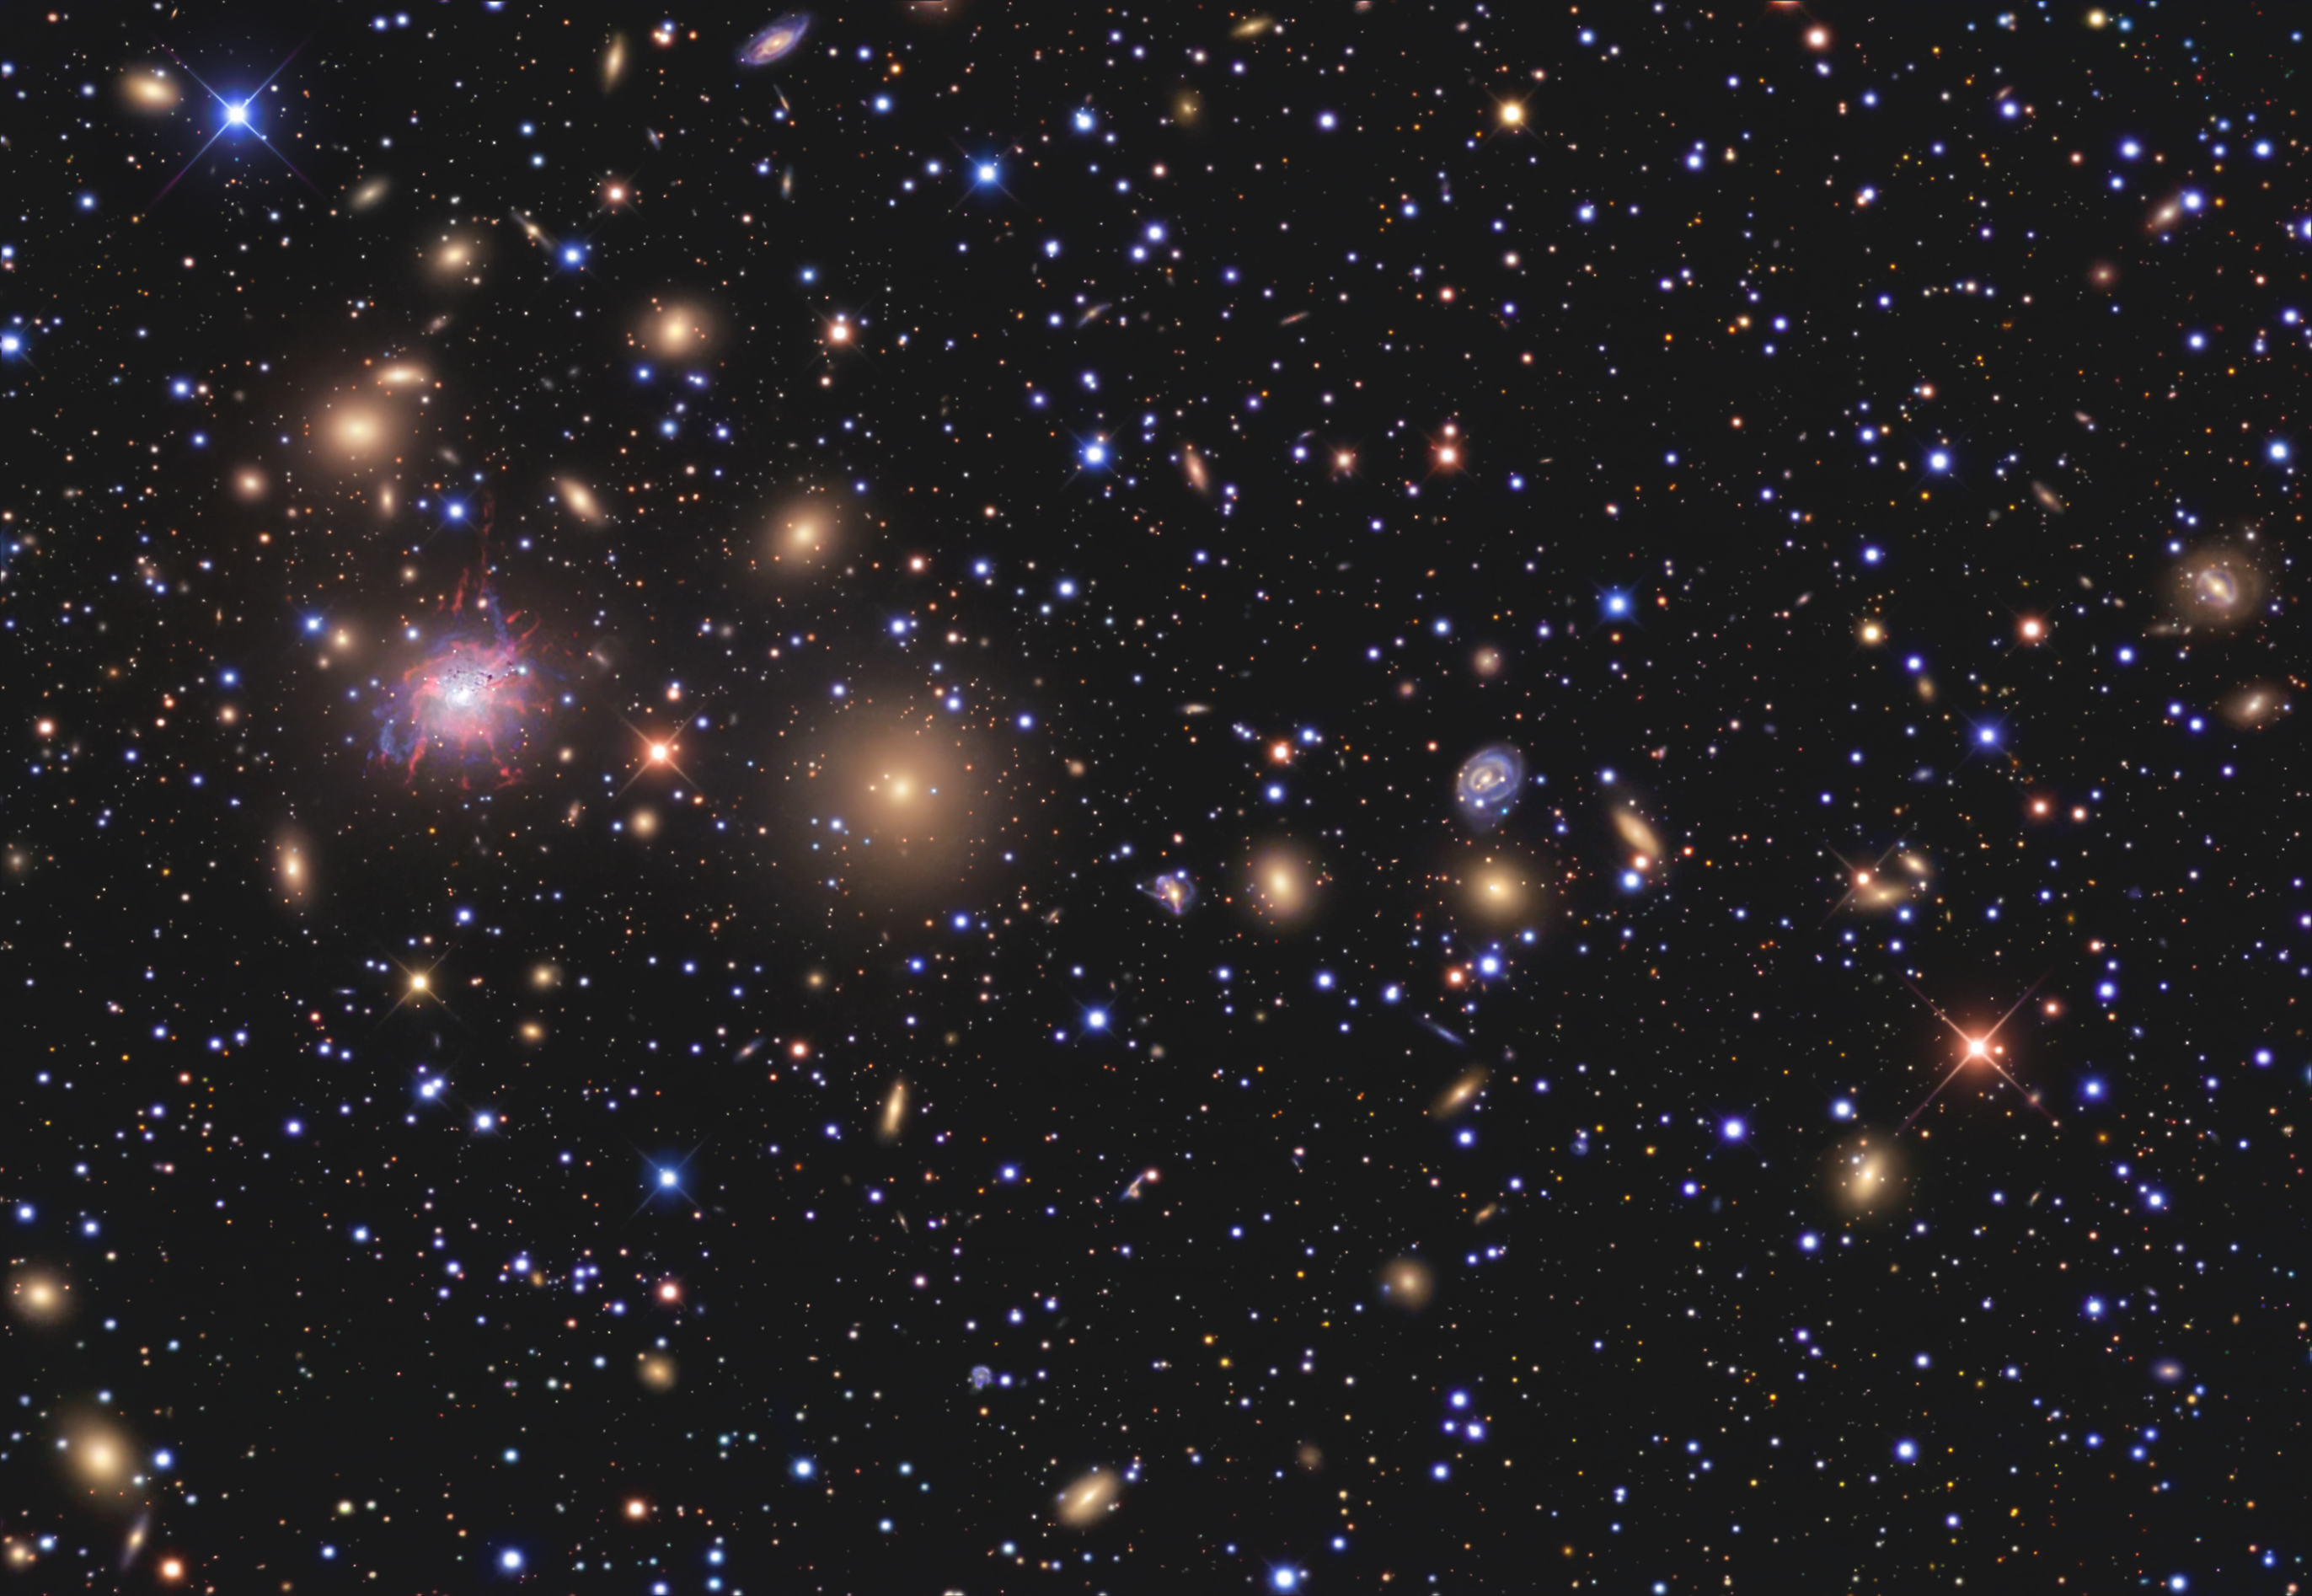
This colorful telescopic skyscape is filled with galaxies that lie nearly 250 million light-years away, the galaxies of the Perseus cluster. Their extended and sometimes surprising shapes are seen beyond a veil of foreground stars in our own Milky Way. Ultimately consisting of over a thousand galaxies, the cluster is filled with yellowish elliptical and lenticular galaxies, like those scattered throughout this view of the cluster's central region. Notably, the large galaxy at the left is the massive and bizarre-looking NGC 1275. A prodigious source of high-energy emission, active galaxy NGC 1275 dominates the Perseus cluster, accreting matter as entire galaxies fall into it and feed the supermassive black hole at the galaxy's core. Of course, spiral galaxies also inhabit the Perseus cluster, including the small, face-on spiral NGC 1268, right of picture center. The bluish spot on the outskirts of NGC 1268 is supernova SN 2008fg. At the estimated distance of the Perseus galaxy cluster, this field spans about 1.5 million light-years.
original caption:
This colorful telescopic skyscape is filled with galaxies that lie nearly 250 million light-years away, the galaxies of the Perseus cluster. Their extended and sometimes surprising shapes are seen beyond a veil of foreground stars in our own Milky Way. Ultimately consisting of over a thousand galaxies, the cluster is filled with yellowish elliptical and lenticular galaxies, like those scattered throughout this view of the cluster's central region. Notably, the large galaxy at the left is the massive and bizarre-looking NGC 1275. A prodigious source of high-energy emission, active galaxy NGC 1275 dominates the Perseus cluster, accreting matter as entire galaxies fall into it and feed the supermassive black hole at the galaxy's core. Of course, spiral galaxies also inhabit the Perseus cluster, including the small, face-on spiral NGC 1268, right of picture center. The bluish spot on the outskirts of NGC 1268 is supernova SN 2008fg. At the estimated distance of the Perseus galaxy cluster, this field spans about 1.5 million light-years.
Copied from Albert Highe's page. This is nice..
Image from DSS, 1deg x 1 deg.
