


TOP > Report & Column > The Forefront of Space Science > 2014 > X-ray Precision Spectroscopic Observation of the Supernova Remnant
![]()

X-ray Precision Spectroscopic Observation with the XMM-Newton RGS While we were discussing about observing with the SXS on the European X-ray observatory ASTRO-H, we found that the Reflection Grating Spectrometer (RGS) installed on the XMM-Newton can be used for the X-ray precision spectroscopic observation of the SNR. Since the RGS is not equipped with a slit, basically it is used for the point source (celestial body which can only be viewed as a point such as a star), and is not suitable for diffusion sources such as the SNR. In fact, however, the dispersion angle of RGS is so large that it is not very sensitive to the spread of the celestial body. Therefore if we focus on the locally bright structure (bright spot or filament structure) or the apparently small SNR, it is able to obtain a spectrum of a high quality. Quantitatively, the spread of the celestial body (θ arc minute [2]) has a relation with the energy resolution (E/ΔE) satisfying the equation E/ΔE=160(1Eθ)-1@=22.1Å. That is to say, if the size of the observed object is just several arc minutes, we will get the spectroscopic performance one order of magnitude higher than the X-ray CCD camera, equaling that of the ASTRO-H SXS. Considering this, hard work for the complex RGS analyses is not painful at all. At the beginning we worked on the Puppis A SNR, which has a lot of bright spots and filament structures. This SNR is the remnant of the supernova explosion occurred about 4500 ago and 7000 light-years away. In the intensity distribution of X-ray (Figure 1), there is a severe unevenness due to density fluctuations in the interstellar-stellar material. Since their sizes are 1-2 arc minutes, they will be great observation targets for the RGS. 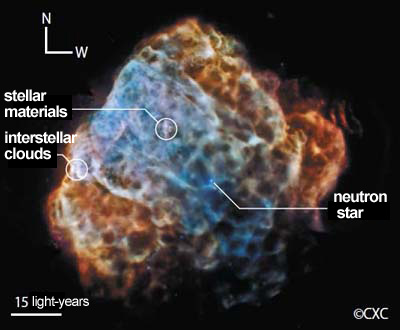
The Puppis A is a core-collapse SNR which leaves a neutron star (a star of masses of neutrons just as its name) after the explosion. Interestingly, we found that most of the stellar materials scattered in the explosion concentrated to the northeast direction, while the neutron star moved to the opposite southwest in a high speed. This indicated that the stellar materials and the neutron star recoiled from each other during the explosion. There were also hints of the same recoil phenomenon in other SNR, although they are not as clear as that in the Puppis A. On the other hand, in recent theoretical researches, this kind of asymmetry is considered to be the key to the mechanism [3] of the supernova explosion. Therefore, to probe into the explosion mechanism of the Puppis A, which is a valuable example of asymmetric explosions, is an excellent opportunity to feed back to the leading theoretical models of the recent years. As a part of this, we observed one mass of the stellar materials with the XMM-Newton RGS. The spectrum we got is shown in Figure 2 (a). The peaks standing here and there are the emission lines from the target (modeled in blue solid lines), while most of the other radiations are substantial background radiations (modeled in grey solid lines) from the peripheral area. The differences between it and the XIS on the Suzaku (the X-ray CCD camera with the highest energy resolution since the past) shown in grey crosses are quite obvious. We can find that the RGS has splendidly separated each emission line one by one. 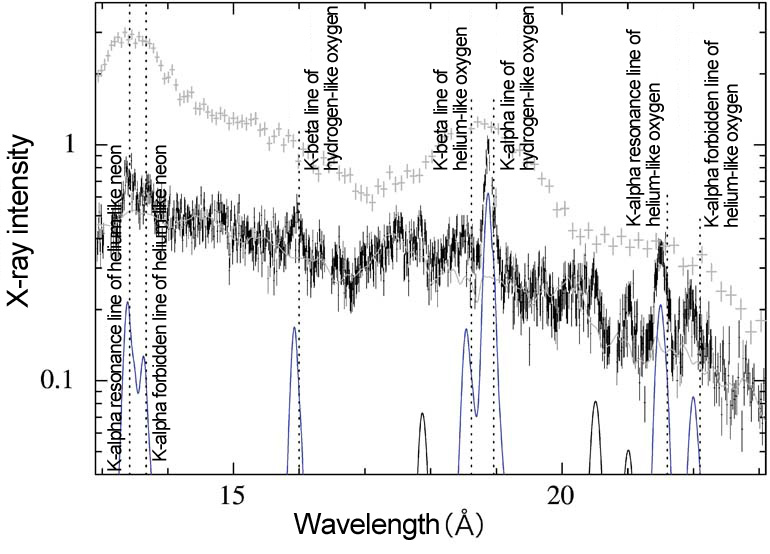
The RGS spectrum gave us new knowledge which we had never got from the X-ray CCD camera in the past. One is the Doppler velocity. When looking carefully at Figure 2 (a), you can find that the emission lines from the stellar material are systematically shifted to the short wavelength side (blueshift) from the position of the wavelength in the stationary system shown by the vertical dotted lines. As a result of analysis, we measured the Doppler velocity (the relative radial velocity towards the Earth) as 1500±200km/s with a very high accuracy. Suppose the lines have traveled at this speed since the explosion 4500 years ago, they have moved 23 light-years in the direction of line of sight from the point of the explosion. From this, we can estimate the position of the scattered stellar material in the direction of the radius. Similarly, by measuring the Doppler velocity of other stellar materials, we will be able to reveal the full picture of the explosion mechanism, but this job will likely be taken over by the ASTRO-H SXS. As to the bright spots in the interstellar clouds, we also succeeded in obtaining the high-dispersion spectrum with RGS. The RGS spectrum shown in Figure 2 (b) is in fact drawn by separating and detecting a lot of emission lines. The K-alpha line of helium-like oxygen [4] is most interesting. We are surprised that the intensity of the forbidden line is as high as 1.5 times that of the resonance line. Such an intensity ratio cannot be explained by the conventional radiation model of the collisional plasma. After we studied various points of view, we thought of the possibility that X-rays from the charge exchange reactionE which was considered almost impossible to take place, might be involved. If it is true, it will be a new clue to explore the SNR. We are looking forward to a thorough investigation with the SXS of ASTRO-H. 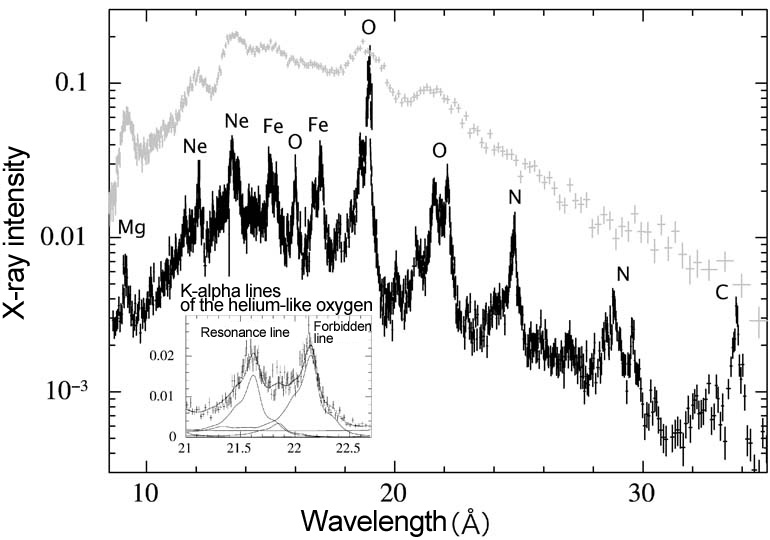
[2] 1 arc minute = 1/60 degrees [3] The mechanism of the core-collapse Supernova explosion is a big problem in the astronomy, lively researches on which have been conducted since half a century ago. [4] The helium-like oxygen means the oxygen ion with only 2 electrons which has the same electron configuration as helium. The K-alpha line is the emission line going with the electron transition (the principal quantum number, n=2 → n=1). Generally there are several K-alpha lines if we take the azimuthal quantum number (ℓ) and others into consideration. For example, the resonance lines in this paper are the emission lines that can be easily detected in ground experiments (emission lines with short transition timescale when ℓ=1 → ℓ=0), while the forbidden lines are the emission lines that can be hardly detected in ground experiments (emission lines with long transition timescale when ℓ=0 → ℓ=0).
|
||||||||||||||