


TOP > Report & Column > The Forefront of Space Science > 2011 > AKARI's Mid-IR All-Sky Survey
![]()

Mid-infrared all-sky survey observation: Problems and solutions The camera was originally designed to perform imaging (about 10-minute observation) by fixing its view to a target object. Therefore, we had to solve various issues to achieve mid-infrared survey observation. The biggest issue was the detector's performance. The detector of the IRC's mid-infrared channel reads out the output of 256 x 256 (about 65,000) elements in chronological order by putting them on four signal lines. However, it cannot usually perform sampling faster than under 0.6 sec cycle when reading out full picture. During a all-sky survey, the satellite constantly rotates to change its attitude. Accordingly, the stars pass by the detector's view at a speed of 216 arcsecond per sec (i.e., 0.06 deg per sec). To obtain resolution equivalent to the detector elements' view (2.34 arcsecond), sampling must be made at a much faster cycling speed than 0.6 sec speed - specifically 0.01 sec. As a solution to this problem, we reduced the number of read-out elements - reading out only 256 elements of one line perpendicular to the satellite's forward direction. Our solution to operate in a thoroughly different manner from the original specification, however, forced us to face two critical problems: an increase in noise (decrease in detection limit); and poor repeatability of optical response (decrease in accuracy of brightness determination) compared to regular image observation. We then looked for an operation method to fulfill our observation requirements. We decided to treat the detector not as a single existing device, but to attempt to understand it physically behaving at the extremely low temperature (~6K) of optical detector semiconductors and integrated circuits. Research to attain the highest detector performance in the highest conditions has been made in many other projects. Our experiment to find the limits of detector performance in order to expand its application range was really new and the core of this project. We devised a method to achieve low noise and stable optical response, and conducted the experiment in our library to detect light crossing in front of a camera. Thus, we were able to verify in advance the feasibility of our idea in a ground experiment. With these measures we were able to plan practically the mid-infrared all-sky survey within the scope of the AKARI operation. We also demonstrated before the AKARI launch that we could retrieve valuable astronomical data. Examples of retrieved data After its launch, AKARI conducted the observation survey for about 16 months until it exhausted its liquid-helium refrigerant. AKARI covered 97% of the all sky, observing most areas more than twice. Fig. 2 shows examples of mid-infrared images of the star formation area. At left is an image from the previous IRAS survey, the data before AKARI. At right is new data from AKARI. Due to the improvement in sensitivity, AKARI reveals many objects never seen before. In addition, the improvement in spatial resolution clearly reveals what was previously thought to be one celestial body to be separate physical-state objects (as shown by arrows in the figures). 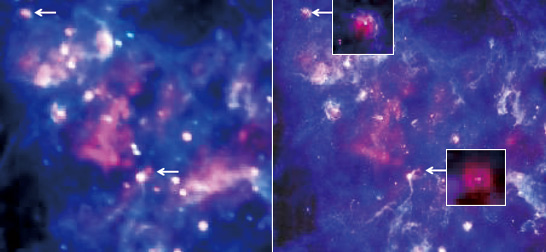
Creation of the point-source catalogue We first created a catalogue of detected point sources (i.e., ones identified as a point source such as stars and distant galaxies) from the retrieved data. In organizing the catalogue we gave priority to reliability rather than the quantity of detected bodies. AKARI has surveyed the same area more than once. We could have increased the number of detected objects by overlapping multiple observation data and creating a deeper map, but we treated the data as independent measurements in order to improve detection accuracy and catalogue reliability. In the process, we excluded some false signals or others that had been included in the data as candidates for celestial bodies. They were: signals by cosmic radiation while AKARI passed through the South Atlantic Anomaly (SAA)*; moving objects such as asteroids and comets; and false detection signals from artificial objects such as geosynchronous satellites and debris (satellite waste). In the end, a total of 870,000 points (840,000 in 9µm band and 190,000 in 18µm band ) were judged to be highly reliable (i.e., static) objects' detection. This is the second all-sky catalogue in mid-infrared region in history, and supersedes the first IRAS catalogue in terms of both number of objects and determination accuracy of brightness and position. Our catalogue was released to the world in March 2010 and is widely and actively used in various fields of astronomy.
|
||||||