TOP > Report & Column > The Forefront of Space Science > 2010 > Mysterious Auroral Events ~ To be Explored by GEOTAIL Satellite
![]()

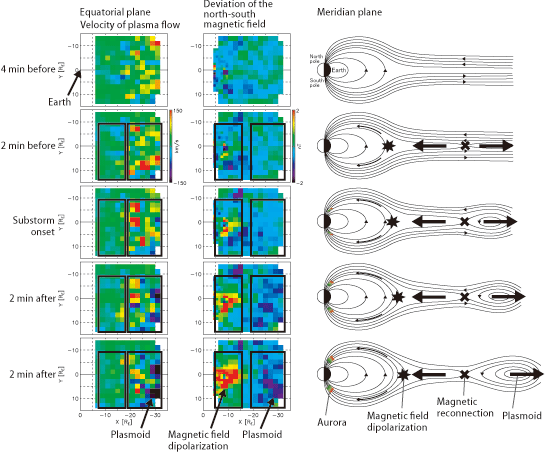
GEOTAIL satellite data analysis In order to pinpoint the substorm trigger, we planned to trace all aspects of the magnetotail before and after a substorm: in other words, an overall profile of what happens when and where.EAt present, the number of satellites observing the magnetotail is five or six at most, making it difficult to monitor all aspects of the magnetotail for a single substorm. Therefore, we adopted a statistical processing approach. Specifically, we collected about 4,000 substorm events from auroral observations and superposed the data from the GEOTAIL satellite for these events by aligning the times of the onset of substorms. With this method, we can view the whole of the magnetotail. GEOTAIL is the first satellite to observe the magnetotail in full scale. It was launched on July 24, 1992, by the cooperation of ISAS, Japan, and the U.S. Although 18 years have passed since its launch, GEOTAIL still continues its observations. The direct in situ observations of event-occurring sites, which are unique to solar-terrestrial physics, provide us with interesting data. The statistical analysis this time became possible because of GEOTAILs long observation of a wide area of the magnetotail that was crucial to understand a substorm. Fig. 3 shows the result of the analysis. We examined various physical quantities. Fig. 3, however, shows only the plasma flow velocity and the north-south component of the magnetic field, which are especially important in the study of substorms. The right column shows conceptual illustrations of the magnetotail during a substorm. First, looking at the region from X~-20 REEto E30 REEsurrounded by black-line squares on the right side of the left column of Fig. 3 showing the plasma flow velocity , deep blue appears two minutes before the substorm onset. After the onset, deep blue rapidly increases. This suggests that the high-speed plasma flow moving away from the Earth grows. Meanwhile, looking at the same region in the middle column of Fig. 3 showing the deviation of the north-south magnetic field, the color becomes deep blue two minutes before the substorm onset. This implies that the magnetic field grows southward. From these results, we can conclude that the magnetic reconnection outlined above occurs in the X~-20 REEregion at two minutes before the substorm onset and that a plasmoid is formed and grow on the far side of X~-20 REEfrom the Earth. Further, looking at the X~-7 REEto E10 REEregion surrounded by squares on the left side in the middle column of Fig.3, the red-colored portion appears almost simultaneously with the formation of the plasmoid and begins to expand in all directions. This suggests that the magnetic field grows northward, i.e., magnetic field dipolarization occurs there. On the Earth side of the magnetic reconnection region (i.e., the region surrounded by the left side squares in the left column of Fig. 3), however, there is only a few high-speed plasma flows toward the Earth (yellow to red). This may reflect the structure of the magnetotail. Further study is needed to find a detailed explanation for this result. As described above, the change in plasma flow and magnetic field obtained by our analysis agrees well with that predicted by the magnetic reconnection model. We also obtained detailed analysis results for other physical quantities such as energy change and energy flow although they are not shown here. From these findings, we were able to understand the temporal and spatial changes of the magnetotail structure and aspects of the energy flow before and after a substorm. Further, it was revealed that magnetic reconnection releases energy accumulated in the magnetotail and plays an important role in causing changes in magnetotail structure. 
Future research Although we have uncovered the overall profile of changes in the magnetotail during a substorm, many questions remain. One example is the detailed physical mechanism and cause-and-effect relationship of substorm processes arising between magnetic reconnection and violent auroral activity. Future observation programs of the magnetosphere are now promoted in Japan and overseas. In Japan, the ERG and SCOPE missions have been proposed. The former is to observe the near-Earth region of the magnetosphere, and the latter is a multi-spacecraft formation flight to observe the magnetotail. As for other planetsEmagnetosphere where events similar to a substorm occur, a Mercury-exploration mission called BepiColombo and a Jupiter-exploration mission are in progress. By comparing the Earths events with other planetsEones, increasing the number of observation satellites, and improving instrument performance, we expect to advance our understanding of substorms and common space plasma. Yukinaga MIYASHITA
|
||||||


