


TOP > Report & Column > The Forefront of Space Science > 2008 > Source of Solar Wind Revealed by HINODE
![]()

Observation of the solar wind’s source Fig. 1 shows the solar corona shot by HINODE's XRT. In the left image showing the entire Sun, an active region is visible in the center (region of bright corona in soft X-ray over sunspot, etc.). A coronal hole can also be seen next to the active region. A coronal hole is a dark corona region, so named because it looks like a hole when observed in soft X-ray. The right image shows the enlarged observed area by XRT. As indicated by dotted lines, streaky magnetic lines extend upward from the border of the active region and the corona hole. It was discovered that coronal gas flowed out continuously along these magnetic lines during the three-day observation period. The white circle in the figure shows the spot where the gas emerges, or the root of the streaky magnetic lines. Temperature measurement with XRT indicated that the temperature of the gas was about 1.1 million deg. C. YOHKOH's SXT was unable to trace the movement of this temperature gas. On the other hand, it was found that, based on the pattern of the gas flow, the speed of the gas in the projection plane (plane perpendicular to the line of sight) was typically 140 km/sec. 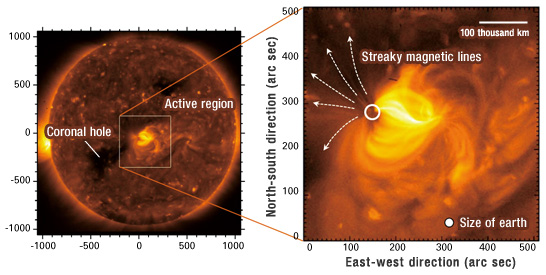
Incidentally, even if what travels on the magnetic lines is not flow (movement of gas in one direction) but wave (density wave), the pattern would be observed as if it were gas flow. The spectral data by EIS observation conducted simultaneously, however, showed that the emission-line spectrum of coronal gas at the gas outflow site and its vicinity was Doppler-shifted to shorter wavelength side (Fig. 2). This suggests that the gas comes in our direction at about 50 km/sec. By merging the observation data of XRT and EIS, it was confirmed that the gas indeed moved up. 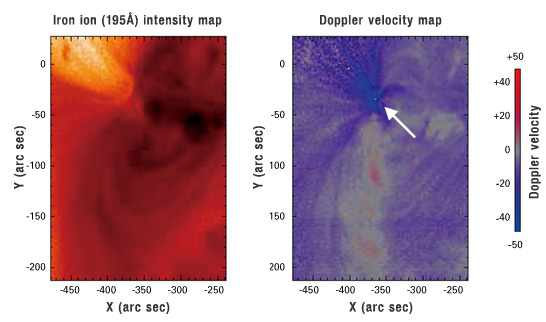
|
||||||