


TOP > Report & Column > The Forefront of Space Science > 2006 > Mass Estimation of Very Small Asteroid
![]()

Fig. 3 shows the range data (distance calculated from round-trip time of the radiowave between the ground station and the explorer) and the Doppler data (velocity in the line of sight direction calculated from frequency changes of the radiowave) for the three months HAYABUSA stayed around Itokawa. In Fig. 3, values are expressed in O-C. Generally, O-C indicates the differences between observed values (O) and theoretical values (C) and, in case of explorers, C is calculated from determined values of their orbits. In this Fig. 3, however, C is values that were calculated from the orbit of Itokawa. This means that the O-C of the range is the difference in the sight-direction distance between HAYABUSA and Itokawa (negative values show that HAYABUSA is located in front of Itokawa). On the other hand, we can construe that the O-C of Doppler is the velocity of HAYABUSA in the sight direction to Itokawa (plus values show directional movement toward Itokawa). Fig. 3 shows the difficult history of HAYABUSA. 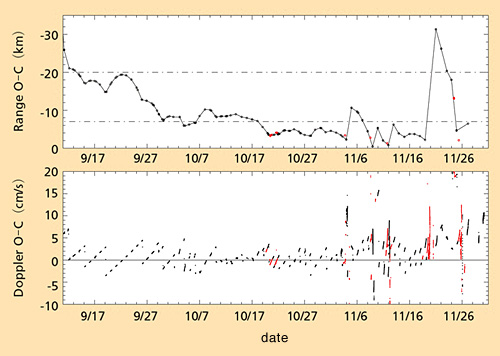
Realizing solar-radiation pressure While HAYABUSA stayed near the gate position, the range’s O-C graph in Fig. 3 is a parabola with upward convexity. Since the horizontal axis is time and the vertical axis is distance, this suggests one-dimensional, uniformly accelerated motion, similar to throwing a ball vertically on the ground. This guess is also proved by the fact that the velocity calculated from the Doppler data increases linearly. Note that, when approaching velocity to Itokawa increased to a certain level, HAYABUSA exerted control to accelerate in the direction moving away from Itokawa to prevent over-approaching. Keep in mind that when we look into the movement of HAYABUSA around Itokawa, we can ignore gravity of the Sun or other planets for now. This is because the gravity of such bodies acts almost equally on both Itokawa and HAYABUSA. The effect of solar-radiation pressure on Itokawa can be negligible, too. Discussion and analysis in this article are based on these approximations. You may think that Itokawa’s gravity can be easily calculated from data in Fig. 3, but this speculation is a little hasty. The reason is that the main cause of the uniformly accelerated motion is not Itokawa’s gravity but solar-radiation pressure. It imposes about 1x10⁻⁴mm/s2 acceleration on HAYABUSA near the gate position. Since the acceleration by Itokawa’s gravity is around 6x10⁻⁶mm/s2, as calculated from its finally determined mass, we can consider that 95% of acceleration acting on HAYABUSA at the gate position is attributable to solar-radiation pressure. As shown in Fig. 1, the direction accelerated by solar radiation pressure and Itokawa’s gravity is almost the same because of their positional relation. Therefore, solar radiation pressure works as if it were Itokawa’s gravity on the explorer. We do not care about solar-radiation pressure at all in our daily lives. For deep space explorers, however, the accuracy of estimation of this pressure significantly affects the accuracy of their orbital determination. In ordinary explorer operation, the pressure does not appear obvious. In the orbital movement of HAYABUSA around Itokawa, it emerged dramatically.
|
||||||