


TOP > Report & Column > The Forefront of Space Science > 2005 > GEOTAIL Satellite - Detailed Story of Astrophysical Gamma-ray Observation
![]()

A huge flare occurred on SGR1806-20 One day, I received an email from Nobuyuki Kawai, Tokyo Institute of Technology, who is playing an active and important role as the Japan representative for gamma-ray astronomical satellite HETE-2. “A huge flare occurred in Soft Gamma-ray Repeater SGR1806-20 for several minutes from 21:30:26 on December 27, 2004 (UT). It was reported that the gamma-ray intensity just after the flare appeared is bigger than that of a solar flare. Do you have any LEP data on it?” 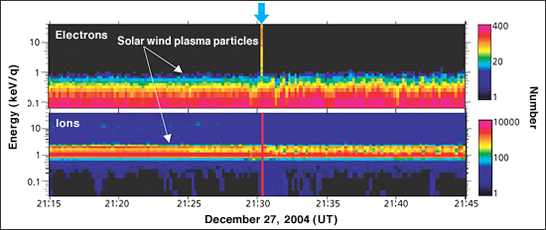
I checked the LEP data then and at first produced Fig. 2. This shows data on electrons (upper) and ions (lower) over 30 minutes from 21:15 through 21:45 on December 27, 2004. Since GEOTAIL was in the solar wind at that time, electrons and ions are continuously observed and expressed in the horizontal belt. Iimmediately found a vertical stripe (indicated by a blue arrow in the center of the figure) crossing the belts of electrons and ions just at the time that Kawai mentioned. Glancing at this figure, I was convinced that we had succeeded in observing a huge flare. We, including graduate student Yasuyuki Tanaka and the other co-authors, concentrated on data analysis until the report was written up at the end of March. During this period, I canceled almost everything except for compulsory work at the University. Only the LEP succeeded in observing the peak Let’s go back to the time just after Fig. 2 was produced. A comparison of the time of the LEP data and the estimated arrival time of gamma rays from SGR1806-20 to GEOTAIL indicated that they coincided within the allowance of data-time accuracy (a few milliseconds). Thus, there was no doubt that we had detected gamma-ray photons from the huge flare. The upper graph in Fig. 3 was produced by re-arranging Fig. 2’s counter data over time. This expression, counter numbers against time sequence, shows that LEP is a gamma-ray observatory with temporal resolution of 5.48 milliseconds. This resolution is not that poor even when compared with gamma-ray dedicated instruments. 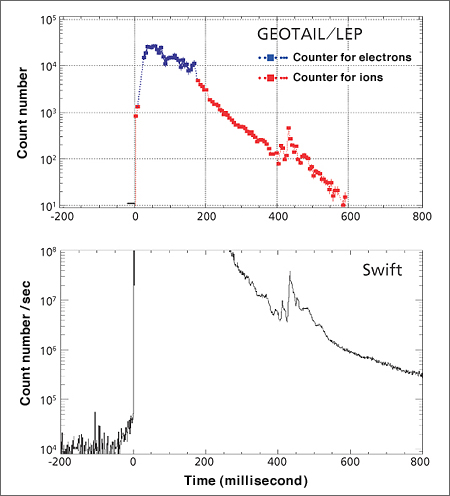
Meanwhile, the data-acquisition status of other gamma-ray astronomical satellites became known. Unfortunately, Kawai’s HETE2 satellite failed to retrieve data because it was in the shadow of the earth seen from SGR1806-20 at the time. Other powerful satellites such as Integral, RHESSI, Konus-Wind and Swift, however, were emerging as our rivals. It later emerged that all the gamma-ray astronomical satellites were unable to obtain the data perfectly because the signals from 200 to 500 milliseconds just after the flare eruption were too strong. Reviewing some quickly released reports, it was found that, although the estimated energy amounts of the peak gamma rays were mentioned, they were not direct data from gamma-ray instruments. Apparently the researchers reproduced, with much trouble, the count number of gamma-ray photons captured by other detectors (e.g., earth radiation-belt monitor) with poorer temporal resolution to the energy amount. “It seems that only GEOTAIL’s LEP retrieved the peak data with high temporal resolution!” Our data was becoming important. At the end of January we decided to organize the data for publication. The lower graph in Fig. 3 is data later released by the Swift satellite. The lack of data in the top extending from 0 to 260 milliseconds is due to strong signals. By comparing the upper and lower figures, it can be seen that LEP data fill the gaps in the Swift data perfectly. Further, based on the results of sensitivity calibrations using solar-flare gamma rays over the past five years, it was confirmed that the power of the peak gamma rays is incredibly large: 20 erg/sec per 1 cm square.
|
||||||||||||||||||||||||||||||||||||||