

TOP > Report & Column > The Forefront of Space Science > 2005 > The Night Sky is Bright !? - Exploring the First Light in the Universe -
![]()
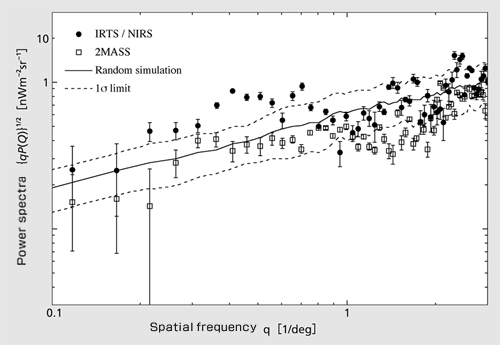
The Universe’s Dark Ages Explored with Cosmic Infrared Background Radiation As part of the observational efforts to shed light on the universe’s dark ages, we thought of observing background radiation in the near-infrared region (wavelength: 1 to 5 Observation was not to be so simple, however. To capture light that has traveled from a distant universe, we must first perfectly eliminate light closer to us. At an altitude of 100km, the earth’s atmospheric nightglow layer completely blocks observation of background radiation from the ground. Further, in the solar system, there are great clouds of fine dust that scatter sunlight to make zodiacal light. This light means the sky even outside the atmosphere is still bright. Also, the existence of dark stars within our galactic system cannot be discounted. Using rocket observations from the mid 1980s, we began research in the near-infrared zone on the nature of brightness and the components of the sky. We were able to measure the sky’s absolute light and spectrum using K-9M-77 (1984) and S-520-11 (1990) rockets, although light from the distant universe could not be identified. Fortunately, full-scale observation of the background radiation was realized later by mounting a near-infrared spectrometer, developed through rocket experiments, on Japan’s first space-infrared telescope IRTS onboard the space experiment/observation free-flyer SFU (see main picture). The SFU was launched in March 1995 and from its observation results we were able to identify for the first time background radiation thought to come from outside our galaxy. Meanwhile, NASA had a similar observation project. NASA loaded cosmic background explorer (COBE) satellite with DIRBE, a light-measuring instrument, for observation of background radiation in the infrared region. COBE was launched in 1989. The data it acquired were open to public, allowing many researchers to carry out fruitful analyses. Despite its great utility in terms of whole-sky observation, COBE produced only light-measurement data and its low-angle resolution made it difficult to eliminate dark stars. Meanwhile, IRTS, with comparatively high-angle resolution, boasted a spectroscopic function but was weakened by its limited observation coverage. With their different characteristics, COBE and IRTS made each other’s observation projects meaningful. Let’s skip to the results. The graph on the main figure summarizes the observation results covering visible light to near-infrared in cosmic infrared background radiation from outside the galactic system, where the zodiacal and stellar light are eliminated. The red dots represent IRTS’s observational results, which complement COBE’s. It is characteristic that the spectrum becomes brighter as the wavelength shortens, and suddenly darkens at around 1 Another important observational point besides spectrum is fluctuation of spatial brightness. In one-dimensional data, IRTS observation identifies a fluctuation at a level of 1/4 of background radiation’s brightness, and shows that its angular scale reaches several degrees (Figure 2). This result does not contradict the COBE observation.
|
|||||||