


TOP > Report & Column > The Forefront of Space Science > 2006 > To Produce Lunar Gravitational Field Map
![]()

The gravitational fields of the Moon and planets can reveal detailed status of their interiors, which cannot be imagined from their surface topography. Next to the Earth itself, the Moon is the most familiar celestial body to mankind. Its gravitational field has been studied in most detail after the Earth. With the lunar orbiting satellite SELENE (Fig. 1), we plan to improve significantly the lunar gravitational field map. Before mentioning the mapping plan, I would like to explain what is discovered by gravitational-field observation. 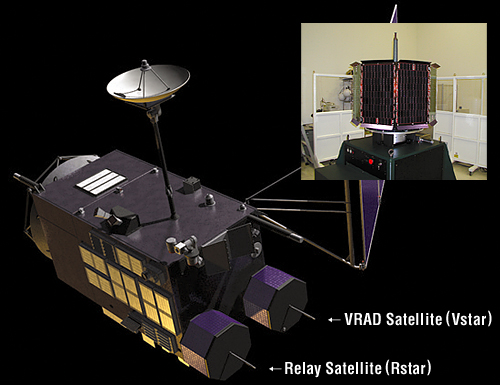
Internal structure of the Moon revealed by its gravitational field 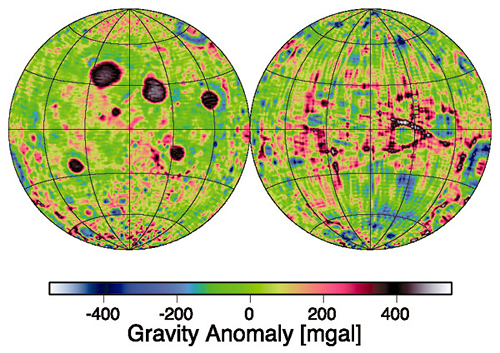
Fig. 2 is a lunar gravitational field map published by Dr. Konopliv et al., NASA, in 2001. This map was created by comprehensive analysis of data obtained by past U.S. explorers including Lunar Orbiter, Apollo, and the latest Lunar Prospector. Left half is the obverse side (i.e., near side) of the Moon visible from the Earth and right half is the reverse side (i.e., far side). The gravitational field map is expressed as the difference from normal gravity on the selenoid or equal-potential plane of lunar gravity. This is called gravity anomaly. The gravity anomaly after correcting the altitude of measured points is called free-air anomaly, while that after correcting the influence of materials between measured points and the selenoid is called the Bouguer anomaly. In places, such as large craters, where isostasy is established, the Bouguer anomaly is high, while in small craters without isostasy the free-air anomaly is low. In this way, we can discern the internal structure such as crust thickness. In particular, the round, dense color areas seen in the near side (Fig. 2) are large gravitational places. Since mass is likely to concentrate inside such areas, it is called mascon. Comparing the gravity anomaly map with the topography map, it is found that mascon locations coincide with large craters. From such observational facts, it is thought that, when craters were formed by huge meteorites in the early stage of lunar evolution, intrusion of high-density mantle materials and/or concentration of lava in basins occurred. The gravitational map is also represented as expansion coefficients of spherical harmonics. For the Moon, up to 150th is estimated, although this depends on individual prediction models. As the order becomes higher, it represents finer internal structure, while lower degrees represent the overall structure. In particular, the Moon’s inertia moment is obtained from values of term “C22” of the second dimension. If the lunar core’s size is calculated from data from, for example, seismometers, the core’s density can be estimated. Then, we can identify the materials constituting the Moon’s core and compare them with the Earth’s. Next, let us see how the gravitational field is measured.
|
||||||||||||||