
Entire figure of AGN evolution now revealed
Our research was making great strides to nearing its goal.
In addition to the ASCA sample by the ALSS, the AMSS, and deep surveys performed
with the SIS detector, we combined samples of the brighter flux side acquired
by the HEAO-1 satellite and those of the fainter side acquired by the Chandra
satellite, and created a hard X-ray selected sample with an extremely high degree
of identification completeness. All that was left to do was to compute the luminosity
function! But it was not that easy. We spent six months of trial and error to
establish an analysis method that would completely eliminate selection bias.
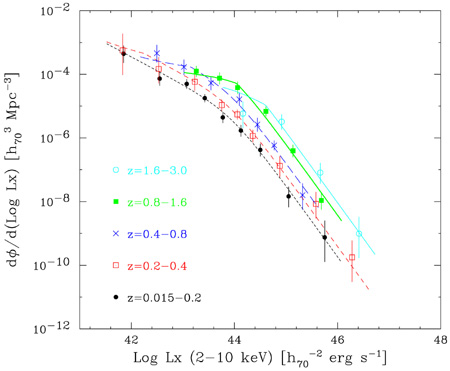
Fig. 2 The hard X-ray AGN luminosity function, in which the
comoving
spatial number density is given as a function of hard X-ray luminosity.
Each redshift parameter range is indicated by a different mark.
Finally, we unraveled the cosmological evolution of AGN luminosity function including
"obscured" AGNs for the first time in the world. In addition, the results
presented the first quantitative answer to the origin of the major part of the
X-ray background. To get to this point, I have spent 10 years and mankind 40 years,
but the answer can be described in a very simple figure. Fig. 2 shows the luminosity
function. Fig. 3 shows the same result when the spatial number density of AGNs
is plotted as a function of redshift parameter (z). Quasars (high-luminosity AGNs)
have the peak around z=2. Meanwhile, the Seyfert Galaxies (intermediate luminosity
AGNs) have peak around z=0.7, indicating that they were formed more recently.
It is interesting that the findings conflict with the "larger is later"
theory of the structure formation of the universe. We think that our results can
be explained from the aspect of star formation activity of the host galaxy. Global
research trends are shifting away from the evolution of AGN itself to study the
relevance of AGNs to the formation process of the host galaxies.
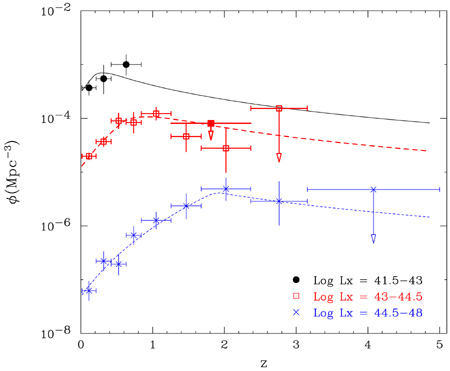
Fig. 3 Redshift dependence of the AGN comoving spatial number
density.
Top(black): low-luminosity AGNs; Middle(red): intermediate-luminosity AGNs; Bottom(blue):
high-luminosity AGNs.
As mentioned earlier, AGN evolution is directly linked to the formation process
of supermassive black holes. By assuming an appropriate radiative
efficiency, we can deduce the mass accretion rate (i.e., amount of prey eaten
per unit time) from the luminosity. Further, we can calculate how the total mass
(i.e., total amount of eaten prey) of black holes per unit volume in the universe
has increased as a function of cosmic time. Fig. 4 is the "black hole growth
curve" obtained by such an approach. We find that the present mass density
of supermassive black holes calculated by the method meets well that estimated
by another method based on the demography of nearby galaxies. A recent, more precise
calculation shows that the mass function of black holes is fully explained as
well. Is this relation true in a distant universe? Was star formation complete
by the time when an AGN activity is triggered? Our challenge continues, with the
stimulation of our rivals around the world.
Fig. 4 The growth curve of supermassive black holes.
The
above curve corresponds to the case when the contribution of Compton-thick AGNs
(i.e.,those with an absorption column density exceeding one Compton-scatteringopacity) is included.
Dotted lines indicate extrapolation.
Epilogue
This achievement indicates the possibility that we can open new scientific frontiers
by effort and teamwork. Also, the result proves the greatness of the ASCA satellite,
which was launched with such fortuitous timing, and the importance of collaborative
study on other wavelengths. I would like to express my deep appreciation to the
joint researchers involved in the ASCA survey and those who participated in the
satellite program.
(Yoshihiro Ueda)
|